Sample Gantt Chart
A Gantt chart or project schedule includes a list of tasks on the left and horizontal bars on the
right showing when the tasks begin and end.
In the Gantt chart below, the task "Do Initial Design" begins January 2nd and ends January 6th.
In this Gantt chart, the smallest increment is one day. You can also draw charts with one hour,
week, or month being the smallest incremental value.
You may want to print this page and follow along as you create your first
Gantt chart.
1. Run RFGantt
In RFFlow click
Tools,
Auto Charts, and
Enter Gantt Chart Data.
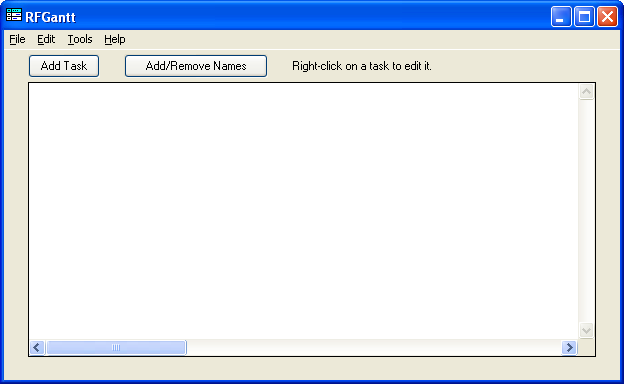
The RFGantt program will run. A screen shot of RFGantt is shown below. This feature is included in both the
free
trial version
of RFFlow and the full version. If you are drawing a lot of
Gantt charts, you may want to add the
Draw Gantt 
and
Edit Gantt 
buttons to your RFFlow toolbar. To do this, click
View,
Toolbars,
and customize the bottom row.
2. Adding a Task
To add a task, click the Add Task button

in RFGantt. The Add Task dialog will appear as shown below. Click the
Task
tab if it is not already selected.
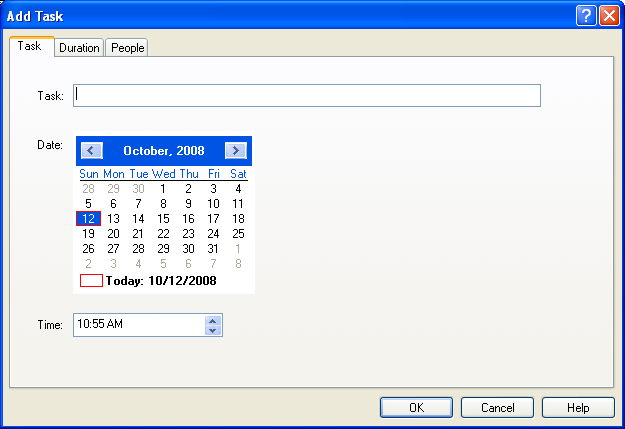
In the
Task: box, enter your task. For example, type "Do Initial Design."
You do not need to number the tasks. This will be taken care of automatically.
Select the starting date for the task. This includes the year, month, and day the task begins.
To change the year, click on the year and then click the small triangle pointing
up or down to increase or decrease the year. To change the month, click on the
triangles pointing left or right to select earlier or later months. To select
the day, click on the day. The current day will be highlighted. To change the
time, click on the time and then click on the up or down arrow.
Next click the
Duration tab to fill in the duration as shown below.
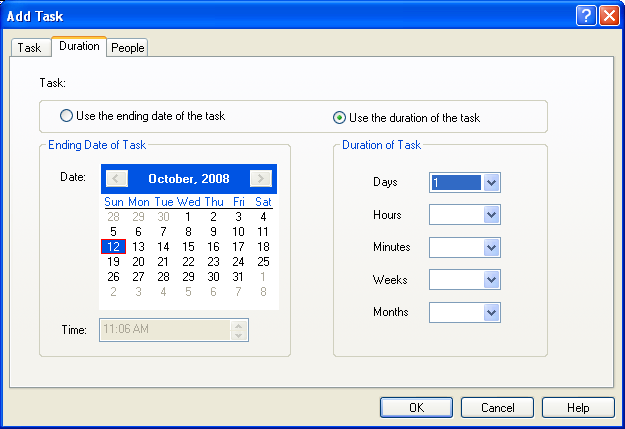
You can specify the duration of the task or the ending date of the task. For
example, if the task takes one day, you would click the round button near
Use
the duration of the task and put a 1 in the
Days box. To specify the
ending date, click
Use the ending date of the task and then select the
ending date on the calendar.
After entering a duration, click the
OK button and your task will be listed.
Right-click on a task in the main screen of RFGantt if you want to delete it,
move it up or down in the list, or edit it.
3. Adding A Title
You can add a title to your chart by clicking Tools in the main menu of RFGantt,
Options, and the Add Title tab. The title will be added to the chart when it is drawn in RFFlow.
4. Saving Your Data
After entering all the tasks, you need to save this data in a file on your hard drive. Click
File in the main menu of RFGantt and Save in the drop-down menu. The
Save As dialog box will appear. You need to save your data so you can import it
into RFFlow to create a Gantt chart. You may also want to edit the data later
adding tasks or changing dates.
The folder where your data will be saved is shown to the right of the words Save
in:. Remember where you saved the file so you can find it again
in step 6 below. Type the name of the file into the box near the words File name:.
Just type the file name.
The extension .txt will automatically be added. The files used
by RFGantt are text files like those created with Microsoft Notepad.
5. Drawing the Chart in RFFlow
After saving the data in a text file, you then import the file into RFFlow.
RFFlow creates the Gantt chart. In RFFlow, click
Tools,
Auto Charts, and
Draw Gantt Chart or click the
Draw
Gantt button
if you have added it to your toolbar.
6. Opening the Text File
The Gantt chart data was saved in a .txt file. You have to be able to browse
to the folder where you saved your file
in step 4 and open it. The
Open dialog box will appear. The folder whose
contents are displayed is listed to the right of the words
Look
in:. To change folders, click on the triangle pointing down and choose a new
folder. You can move up one level in the hierarchy of folders by clicking

. Once you are displaying
the correct folder, simply click on the file and click the
Open button.
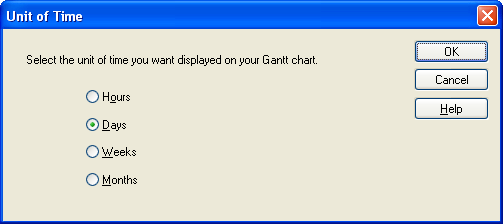
7. Selecting the Unit of Time
You can create a Gantt chart that displays in hours, days, weeks, or months. You
may want to try different units. In general, the larger the unit of time, the
smaller your chart will be.
Hours are used in making a
work
schedule chart. Instead of having a list of tasks on the left, you have a
list of workers. The bars show when a worker begins and ends their shift.
Weeks or months are used if you have tasks that last a long time. You could use
days instead of months as the time increment, but that would result in a chart of several pages or
a one page chart with a very small font.
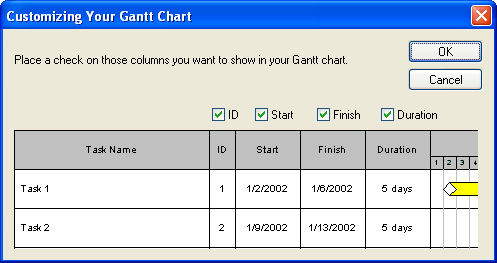
8. Selecting Columns
All Gantt charts must have a list of tasks on the left, but the other columns are optional. You can show or not show the ID number for each task,
starting date of each task, ending date of each task, or duration of each task.
A check mark means that the column will be shown. The advantage of not showing
all this information is that you can make the Gantt chart smaller so it is more
likely to fit on one page.
9. RFGantt Options
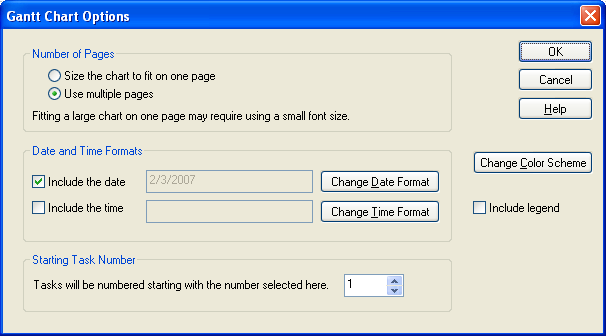
There are a number of ways to customize your Gantt chart.
- Number of Pages - If you try to fit a large chart on one page, the font
will become very small making the chart hard to read. You may want to try
one page at the start and then switch to multiple pages if that doesn't
work.
- Date and Time Format - In the Start and Finish columns, you can decide to
display the date and time and how they are formatted.
- Starting Task Number - If you have a big chart with over 25 tasks, you
should split it into two files or the font will be very small. If you split
a Gantt chart into two files, then you will want the numbering on the second
file to start at the next task number. For small charts, this value is
always left at 1.
- Change Color Scheme - This allows you to select a color scheme for your
Gantt chart. In the list of color schemes, the next to the last scheme is
the one shown in the sample below. It is blue with orange task bars.
- Include Legend - If you associate people with a task, then you will want
to include a legend. This is explained later in this section.
10. Finished
After clicking
OK in the dialog box above, RFFlow will draw your
Gantt chart. At the end of this process, you will end up with two files.
One is the text file (.txt) where you saved the data.
That file was generated by RFGantt. The other file is the RFFlow file
(.flo) which contains the actual Gantt chart.
Both should be saved as you may want to edit the RFGantt chart data and generate
another slightly different chart.
11. Editing your Chart
There are two ways to edit your Gantt chart.
- You can open the Gantt chart data file (.txt) and make changes to the
data. Then you have to generate the chart again in RFFlow. To do this, run
RFFlow and click on Tools, Auto Charts, and Enter Gantt
Chart Data. The RFGantt program will run. In RFGantt, click on File,
Open, or click on File and click on the name of the file you
want to open. The last 9 files you opened are listed at the bottom of the
File menu.
- You can also make edits to your Gantt chart in RFFlow. You can edit it using
all the editing features of RFFlow. It is just like any other chart that you
draw in RFFlow. You can edit the text, add more text, delete shapes, move
shapes, add lines and change colors as
usual. RFFlow is unique in that the finished chart can be fully edited.
You may want to use white task bars to place over the colored ones. The white
task bars are located in the Gantt Charts stencil. Click
 ,
Gantt Charts, and the Add Stencil button.
,
Gantt Charts, and the Add Stencil button.
The colored area shows how much of the task is completed.
Additional Features of RFGantt
1. Associating People with Tasks
You can associate people with each task. For example, if the task is to
"Write Business Plan" and Henri Bergson is responsible for writing the
plan, the final Gantt chart would list the task as "Write Business Plan
(C)" and in the legend there would be an entry "C. Henri Bergson."
This allows you to see what people or groups are associated with each
task.
The first step in associating people with a task is to enter the people.
In RFFlow, click on
Tools,
Auto Charts, and
Enter Gantt Chart
Data or click the
Edit Gantt button
.
In the RFGantt program, click the Add/Remove Names button
.
The dialog box shown below will appear.
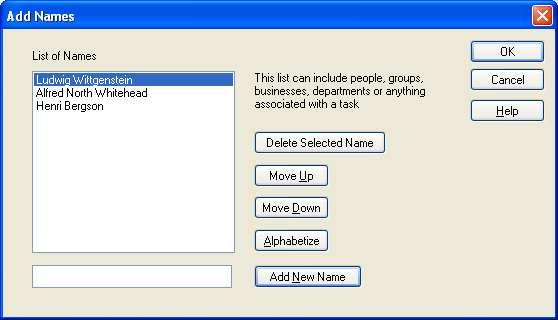
To add a name, type the name in the box to the left of the button
Add New
Name and then click the
Add New Name button. The name will be added
to the list at the top. The names are arranged in the order they are added, but
you can change the order or put them in alphabetical order. To move a name up,
click on it and click the
Move Up button. If you want the names sorted by
last name, type the last name first, e.g. Washington, George. You can use names
of groups, departments, divisions, etc., or names of people.
To remove a name, click on the name in the list of names to select it. Then
click the
Delete Selected Name button. You can only delete one name at a
time. The only way to edit a name is to delete it and add it again. When you
delete a name, it will also be removed from any task to which it is connected.
When you are done adding or removing names, click the
OK button.
The next step is to associate a name with a task. To edit a task in RFGantt,
right-click on the task and select
Edit Task. The Add Task dialog box
will appear. Click the
People tab.
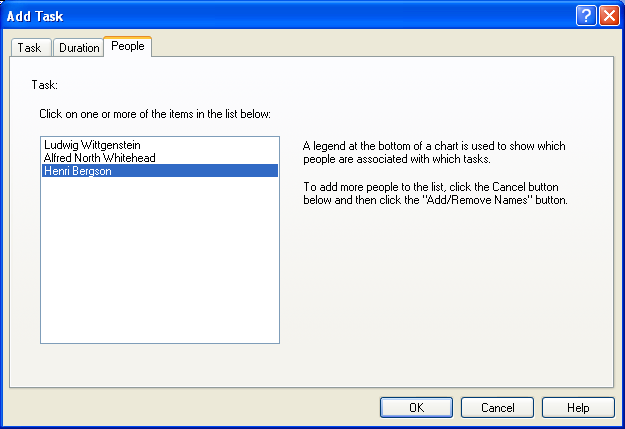
Click on those people who you want associated with the task. To select a person,
you click it. If you want to remove the selection, click it again. You can click
on more than one person. In the picture above, Henri Bergson was selected. Do
this for each task.
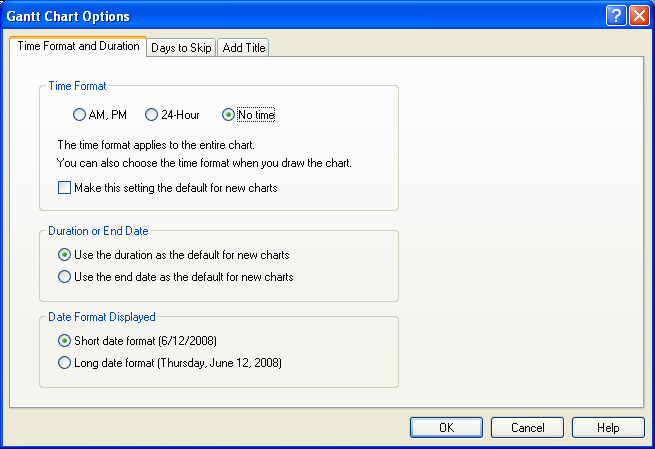
2. Time Format and Duration
In the RFGantt program, click
Tools,
Options. Then select the
Time
Format and Duration tab shown below.
- Time Format - If you are measuring a task in days, you probably don't want
to include time and should click No time. If you want to enter time
data, then you can select to enter it in an AM, PM format or in a 24-hour
format. This selection applies to data entry in RFGantt. When you generate
the chart in RFFlow, you can make different selections.
- Duration or End Date - This simply sets up the default selection. You can
select the duration or the end date as the default for new charts.
- Date Format Displayed - In the main screen of RFGantt the date can be
displayed in a short or long format. You select that format here. When you
generate the chart in RFFlow, you can select a different format for the date
and time. This selection only affects RFGantt.
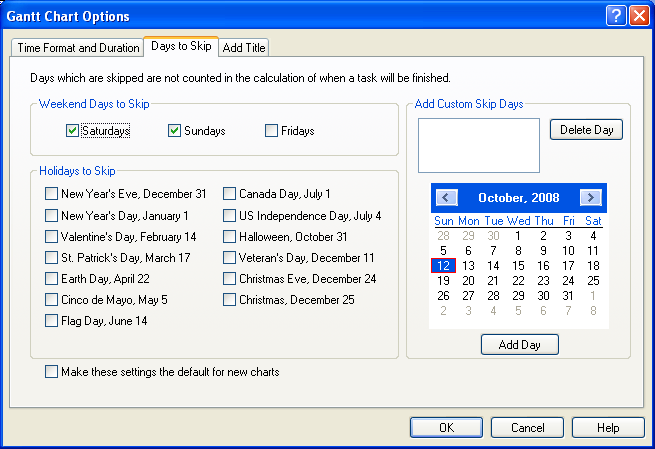
3. Days to Skip
In the RFGantt program, click
Tools,
Options. Then select the
Days
to Skip tab shown below.
You may want to skip and not count days such as Saturday, Sunday, and holidays.
For example, if your business does not work on the weekends, then a task that
starts on Friday and takes 2 days will end on Monday. The two working days are
Friday and Monday, while Saturday and Sunday are skipped and not counted. There
is also a section where you can set up a custom list of days to
skip or to add holidays that are not listed. A Gantt chart using weeks or months
ignores the skip days and does not skip any days. If you specify the ending date
of a task, then skip days are ignored.
4. Add Title
The
Add Title tab allows you to add a title to your Gantt chart.
See also:
