| Professional Flowcharting | Home | Samples | Overview | Download Trial | Tutorial | Purchase | Upgrade | Support | Search |
Cause-And-Effect Diagram or Fishbone Diagram |
| Description | 
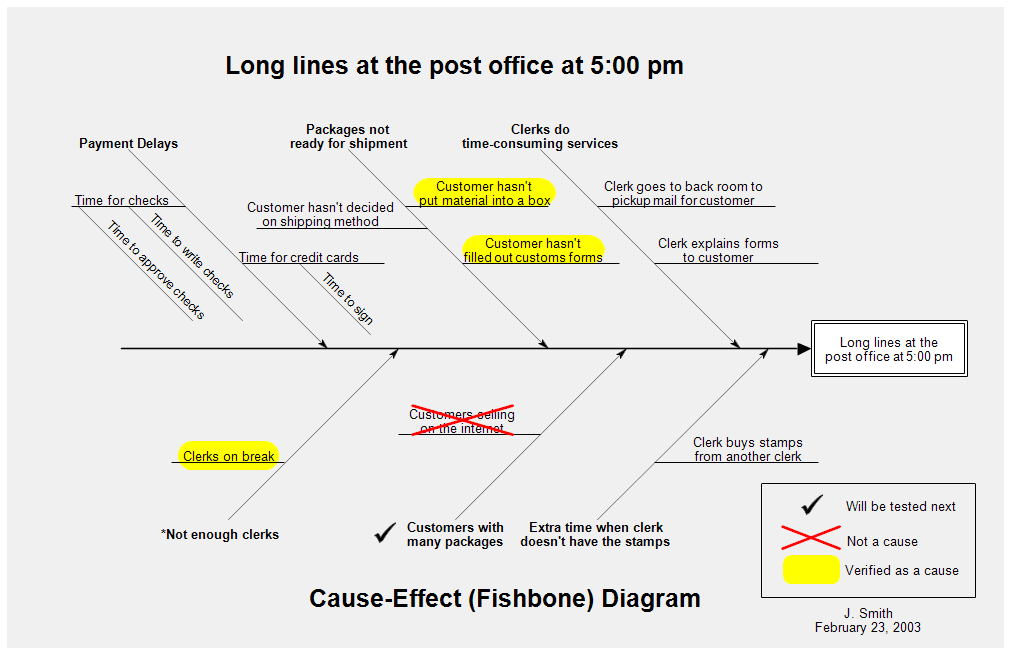
Cause-and-effect diagrams are also called Ishikawa diagrams after their creator,
Dr. Kaoru Ishikawa. These diagrams are used in identifying and organizing the
possible causes of a problem. They are sometimes referred to as fishbone
diagrams because they resemble the skeleton of a fish, with a head, spine, and
bones. The problem to be solved is placed in the box on the far right. It should be a well defined problem with a narrow focus, or the chart will get too large. The spine is a large horizontal arrow that points to the problem box. The lines diagonally pointing to the spine are the main categories of potential causes of the problem. The smaller lines are more detailed causes of the problem. |
| Drawing Instructions | If you haven't already done so, first download the
free trial version of RFFlow. It will allow you to open any chart and make
modifications. Once RFFlow is installed, you can open the above chart in RFFlow by clicking on fishbone-post-office.flo. From there you can zoom in, edit, and print this sample chart. It is often easier to modify an existing chart than to draw it from scratch. To draw this chart without downloading it, run RFFlow and click on the More Shapes |
| Register | Documentation | Privacy and Security | Version Information | Free Additional Shapes | Software Resellers | Free Viewer | Contact |
| RFF Electronics |
| PO Box 1244 |
| Copyright © 1996-2010 RFF Electronics. All rights reserved. |