
Professional Flowcharting Software
|
|
|
|
|
|
|
|
Professional Flowcharting Software
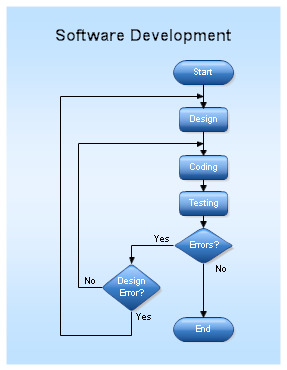
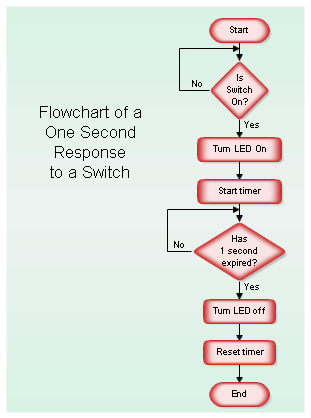
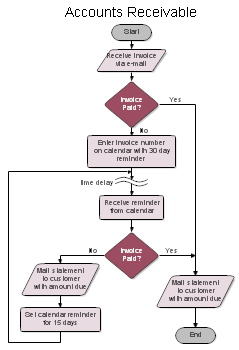
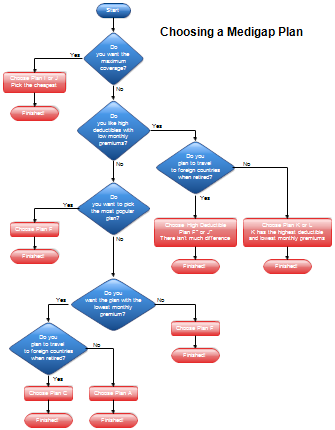
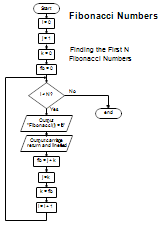
Sample Flowcharts and Templates
Detailed Flowchart - Driving a Stick Shift
Click to enlarge image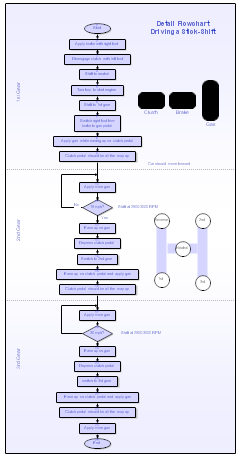
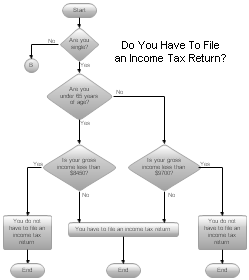
Do You Have to File an
Income Tax Return in 2007?
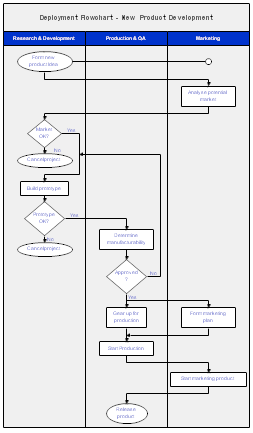
Deployment Flowchart
New Product Development
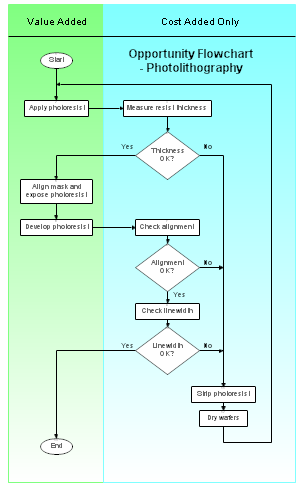
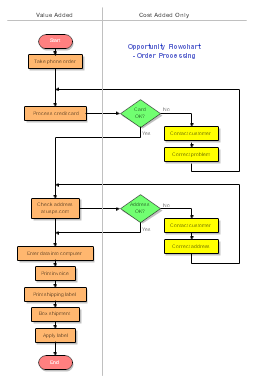
Opportunity Flowchart
Photolithography
Opportunity Flowchart
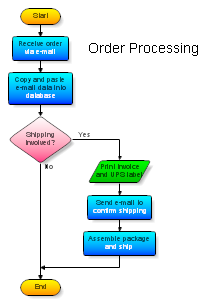
Order Processing
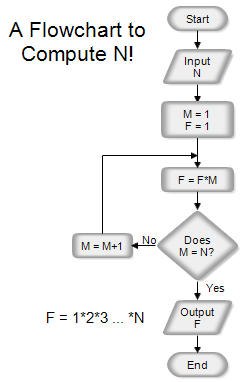
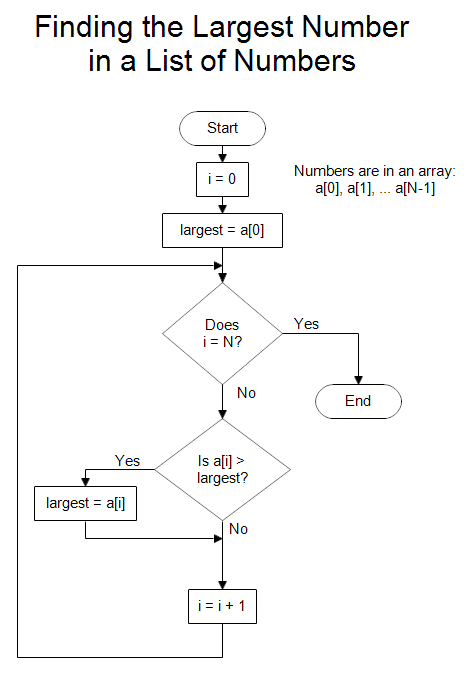
Find the Largest Number in a List of Numbers
Click to enlarge image