Which flowchart shape should you use? If you are new to
flowcharting, the large number of shapes can be intimidating. This page should
help in making your decision. Most charts can be drawn with the first five
basic flowchart shapes listed. The others are optional and often only confuse people. See
also:
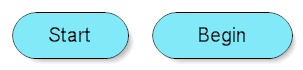
Terminal or Terminator Shape

This shape tells you where the flowchart begins and ends. It
shows the entry point of your flowchart and the exit point. To designate the
start of your flowchart, you would fill this shape with words like
Start
or
Begin. The words you use are up to you.
To designate the ending point of the chart, this shape is filled with words
like
End,
Exit, or
Return.
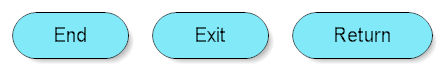
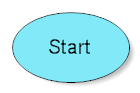
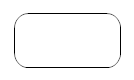
Usually a flowchart has one starting point. However, a flowchart can have
as many ending points as needed. Sometimes you see this shape drawn as an oval
as shown below. That is fine.
Lines with Arrows
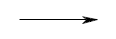
You read a flowchart by following the lines with arrows from
shape to shape. The lines with arrows determine the flow through the chart.
Flowcharts are usually drawn from top to bottom or left to right. Numbering
shapes is optional. Numbering is helpful if you have to refer to a shape in a
discussion. In RFFlow you can turn on numbering by clicking on
Tools
and
Number Shapes. Numbering does not determine the flow of control.
That is determined by the lines with arrows.
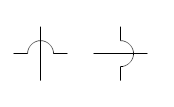
If two lines cross, you ignore the perpendicular line and continue
following the line to the next shape. If there may be confusion as to the
path, you can insert a bridge or
crossover, which is a little bump on crossed lines. In RFFlow, you can insert bridges on crossed lines by clicking on
Tools,
Global Changes, and
Add Crossovers.
Rectangle
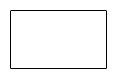
In most flowcharts, the rectangle is the most common shape. It
is used to show a process, task, action, or operation. It shows something that
has to be done or an action that has to be taken. The text in the
rectangle almost always includes a verb.
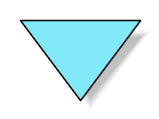
Decision
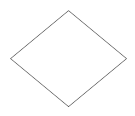
A decision asks a question. The answer to the question
determines which arrow you follow out of the decision shape. For example, in
the shape below, if it is cloudy, you follow the arrow down
near the word
Yes. If it is not cloudy, you follow the arrow to the
right near the word
No.
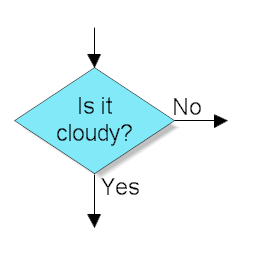
The arrows flowing from the decision shape are usually labeled with
Yes,
No or
True,
False. But you can label them any way you
want as long as the meaning is clear. This shape has one input arrow. It is
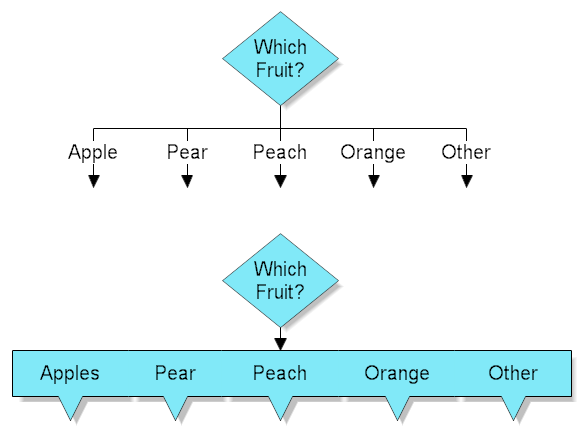
usually at the top, but can be on any corner. The decision shape can have two
or three exit points. If you need more than 3 exit points, then you can use
either of the methods shown below.
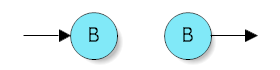
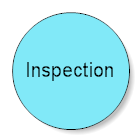
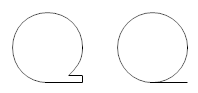
Circle

If you need to connect to another page or another section of the chart, and
can't draw a line, you can use a circle. You draw the line to the circle and
label the circle with a letter. Then you place a copy of the circle where you
want the flow to continue. This should be avoided, but sometimes is necessary.
Originally the circle was used only to reference another part of the chart and
the off page connector, shown later, was used to go to another page. However,
the circle is now often used for both.
In Process Mapping the circle represents an Inspection. At an inspection, the
quality of the product is evaluated. The flow continues only if the product is
approved.
For most flowcharting you
need only use the basic flowchart shapes listed above.
Those listed below are included to be complete, but you don't have to use them.
If you are working in a group, you should decide which
flowcharting shapes should be used and form your own standards. There are no
universal standards in flowcharting. There have been ISO standards written, like
ISO 5807 and DIN 66001, but they were largely ignored. DIN 66001 seems to be
popular in Germany. It is important that people reading a
flowchart understand the information it is trying to convey. Using more than the
basic shapes often confuses people and adds nothing to the overall goal of your
project. Flowcharts can be helpful in understanding a process. The goal should
be understanding and improving the process and not be just generating
flowcharts.
Delay

The Delay shape represents a waiting period where no activity is
done. In Process Mapping, delays are often important as they may result in
adding to the cost of the product or simply delaying its production. Delays
should be analyzed to see if they can be minimized or eliminated.
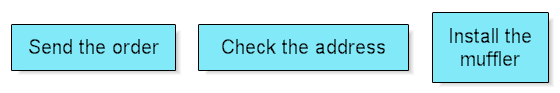
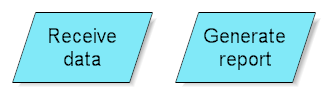
Input or Output
A parallelogram is used to show input or output.
Examples of input are receiving a report, getting an email, getting an order,
receiving data in some format, etc. Examples of output are generating a
report, sending an email, etc.
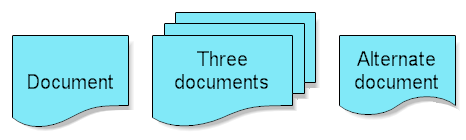
Document
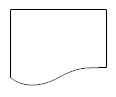
A rectangle with a curved bottom represents a
document or report. The curve on the bottom is sometimes drawn differently as
shown in the Alternate Document below. Now you may ask, "What if the
document is an output. Which shape do I use?" Flowcharting is not like
mathematics. There are no standards that everyone agrees upon. So
your group should set your own standards.
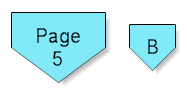
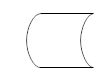
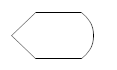
Off Page Connector

This shape means the flow continues on another page.
A letter or page number in the shape tells you where to go. It is an
alternative to using a circle.
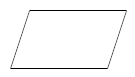
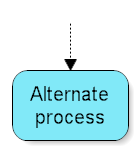
Alternate Process
The rounded rectangle is sometimes used instead of
the standard rectangle and can have the same meaning. However, it is also used
as an alternate process. The lines associated with the alternate process are
usually dashed. It allows you to specify a process in a sharp cornered
rectangle and an alternate process in a rounded rectangle. Some people also
use the rounded rectangle for an automated activity.
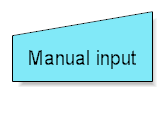
Manual Input
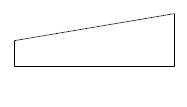
This shape looks like a side view of a keyboard and
often represents entering data into a computer via a keyboard.
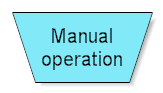
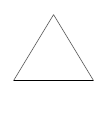
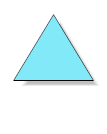
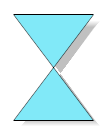
Manual Operation
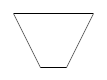
The trapezoid shape represents a manual operation.
That is any operation or adjustment that has to be done by hand rather than
automatically.
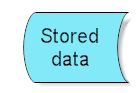
Stored Data
This shape represents stored data. The data may be
stored on a hard drive, magnetic tape, memory card, of any storage
device.
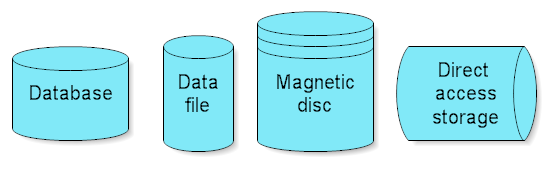
Database
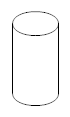
A cylinder represents a data file or database. This
shape can also represent the magnetic disc itself. A hard drive is referred to
as direct access storage since any sector on the drive can be accessed. A tape
is sequential access storage as the data has to be read sequentially.
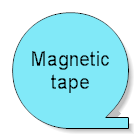
Magnetic Tape
This shape is supposed to look like a reel of tape
with a small portion of tape extending from the reel. It represents magnetic
tape storage which is also called sequential access storage.
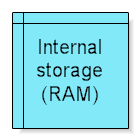
Internal Storage

This shape used to be called
Core and
referred to the magnetic core memory of early computers. It now refers to RAM,
random access memory.
Offline Storage
The shape represents storage offline, regardless of
the storage medium. It is also called removable storage. An example would be a
computer tape that has to be physically loaded first before you can access the data.
Another example would be a CD-ROM.
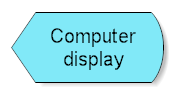
Display
This shape is used to show that the information is
being displayed to the user. It often refers to the display of a PC.
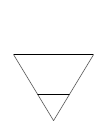
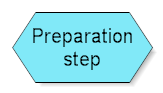
Preparation
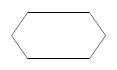
This shape was originally used by IBM programmers to
set a switch, modify an index register, or initialize a routine. Currently you
can use it to differentiate between steps that prepare for work versus steps
that actual do the work. It is probably best not to use this shape at all.
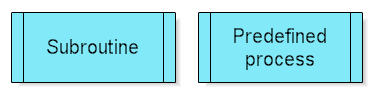
Subroutine or Predefined Process

If you are flowcharting a software program, this is
called the subroutine shape. Subroutines are portions of code that run and
return the execution point to the calling function. This allows you to write
one subroutine and call it as often as you like from anywhere in the code.
Subroutines make the code smaller and easier to test.
If you are not a programmer, this shape refers to a process that is defined
elsewhere. This shape means that there is a flowchart for the predefined
process that has already been drawn and you should reference it for more
information.
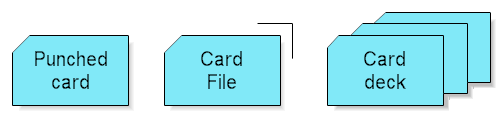
Punched Card

This is the old IBM punched card. Each line of a program was punched into one
IBM card. Then the cards were stacked in order and taken to a card reader.
Usually the student would submit the cards and someone else would run them
during the middle of the night, when the computer wasn't so busy. The output was
printed on wide z-fold paper. If you made a mistake, you would have to resubmit
the cards and wait another day. Large programs had stacks of cards several feet
high. If you are using this shape, you need to update your hardware.
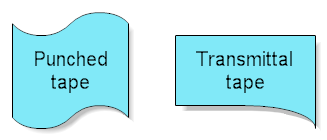
Punched Tape
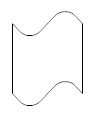
Punched tape is another antiquated technology. A software program would be saved
by noisily punching holes in a paper tape. The paper tape was about an inch wide
and hundreds of feet long. The holes were large enough to see. As the
minicomputer punched the tape, it would stream onto the floor. Then the
programmer would take a battery operated gadget that would wrap the tape into a
nice roll. The computer could read the tape from this roll to reload the
program. If you had a special program that you wanted to save, you would use a
Mylar polyester tape instead of paper, as it was stronger and lasted longer. (My
grandfather told me about this.)
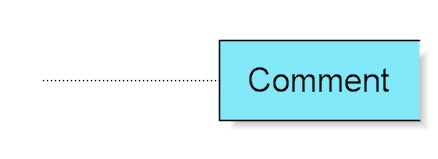
Comment
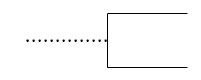
This shape was used to add a comment or additional descriptive text to a
software flowchart. A dotted line should extend from the comment to the symbol
it references. This shape is seldom used today.
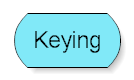
Keying
This is an old shape for an operation using a
key-drive device, such as punching, verifying or typing. It is seldom used
today.
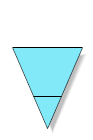
Sort
The Sort shape arranges a set of items or data into a sequence. For
example, you could have a list of names and then sort them alphabetically.
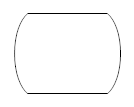
Merge/Storage
The Merge shape combines two or more sets of items
into one set.
In Business Mapping, this shape represents storage. It could be storage of
raw materials or finished goods waiting for a customer. Generally the Delay
shape is used for temporary storage and the Storage shape above is used for
longer storage that may require authorization to be accessed.
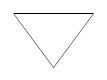
Extract
The Extract shape involves removal of one or more
specific sets of items from a set. For example, you could have a list of addresses
and extract those that are within 10 miles of some location.
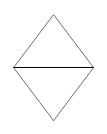
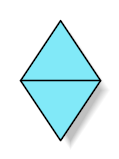
Collate
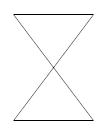
The Collate shape combines merging with extracting.
Two or more sets of items are formed from two or more other sets.
In printing it refers to making several copies of a document while
keeping the pages ordered 1, 2, 3, etc., in each copy.
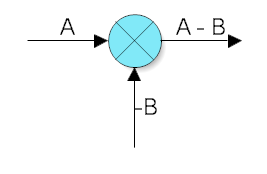
Summing Junction

This shape adds the inputs. To subtract, you add a negative input.
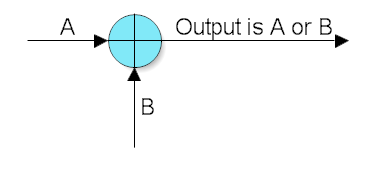
Logical Or

This shape performs a logical Or on the inputs. If the inputs are A and B, the
output could be A or B.
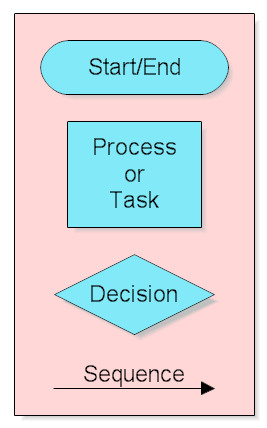
Flowchart Key
Over the years other shapes have been used in flowcharting, but they have not
been popular. If you keep to the four basic flowchart shapes listed first, you will spend
less time teaching new people what each shape means. Even with the four basic
flowchart shapes it is good to have a flowchart key which defines each shape used, like
the one below:
See Also:
