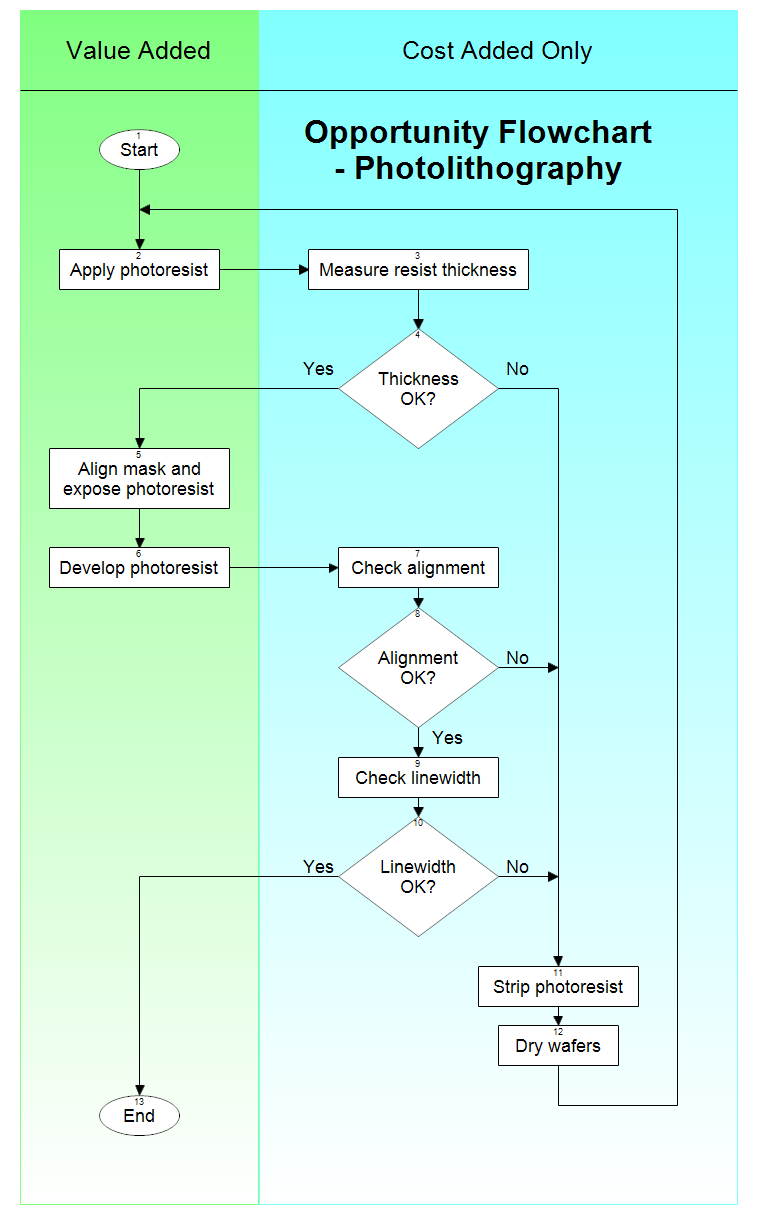
Opportunity flowcharts show the steps in a process and also show whether
each step adds value to a product or only adds cost. Value-added steps are
shown in the left column. These are the steps taken when everything goes
right. Cost-added steps are shown in the right column. These steps only occur
when things go wrong. If there are no problems, then only the steps in the
left column are taken.
Opportunity flowcharts allow you to see where a process can be improved.
They highlight the opportunities for improvement. Opportunity charts separate
those essential steps for making a product from those that are included only
to check for or fix problems.
You can first draw a detailed flowchart of a process and then separate the
steps into value-added or cost-added-only. Ask yourself, "Would this step
be needed if the process worked perfectly?"
By looking at an opportunity flowchart you can quickly see how much work is
caused by things going wrong.

Professional Flowcharting Software
|
|
|
|
|
|
|
|