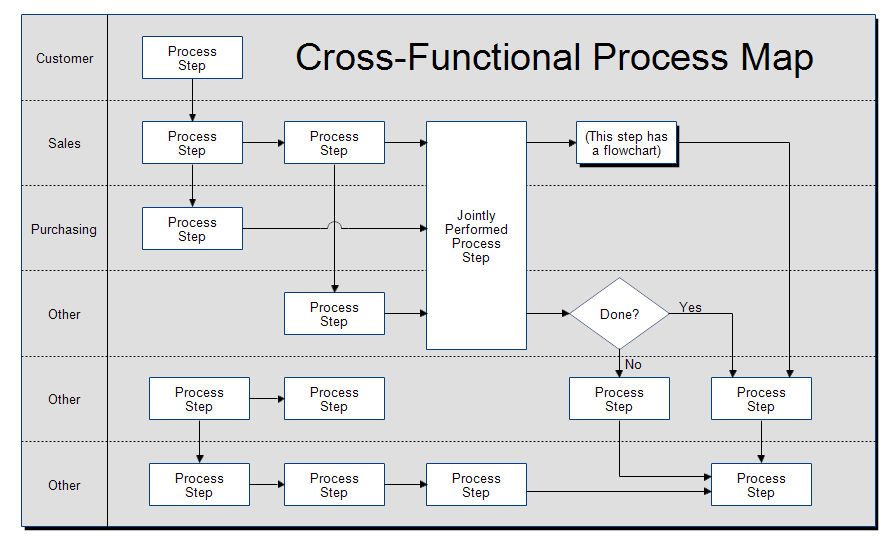
The cross-functional map shown above is part of process mapping.
Process mapping consists of three different kinds of charts:
- Relationship Maps show the overall view. They show the departments
of an organization and how they interact with suppliers and customers.
- Cross-functional Maps or Swim Lane Charts show which
department performs each step and the inputs and outputs of each step. These
maps have more detail than a relationship map but less than a flowchart.
- Process Flow charts or Process Flow Diagrams take a single
step from a cross-functional map and expand it to show more detail. Process
flow charts and process flow diagrams are the same thing.
Maps and flowcharts help people understand a work process. They make the
tasks, interfaces, inputs, and outputs more visible. Analyzing a process map may
help reduce cycle time, reduce costs, and increase productivity.
To download and modify this cross-functional map, see the
Drawing
Instructions below.
The above cross-functional map is a template that you can use to create your own
map.
In a cross-functional map the customer, departments and external companies are listed on the left. They
are separated by dotted lines so it is easy to see which department does which
step. Each department has its own "swimming lane." The steps are connected by arrows to show the order the steps are
performed. The flow is generally from left to right. The lines are labeled with the input or
output of each step.
If you haven't already done so, first
download the
free trial version of RFFlow. It will allow you to open any chart and make
modifications.
Once RFFlow is installed, you can open the above chart in RFFlow by clicking
on
cross-functional-template.flo.
Then follow these steps:
- Double-click on the words Customer, Sales, Purchasing, etc and replace
them with the departments or groups you are interested in.
- Move the boxes around to show the steps in your process. Double-click
the boxes to change the text.
- Connect these boxes with lines. You can add new lines from the stencil
at the left if you want.
- Double-click each line and label it with the actual input or output for
your process steps.
- To duplicate a shape, right-click on it and choose Duplicate.
- To delete a shape, right-click on it and choose Delete.
To draw this chart without downloading it, run RFFlow and use the Sample
Stencil.
See also:
Process Mapping

