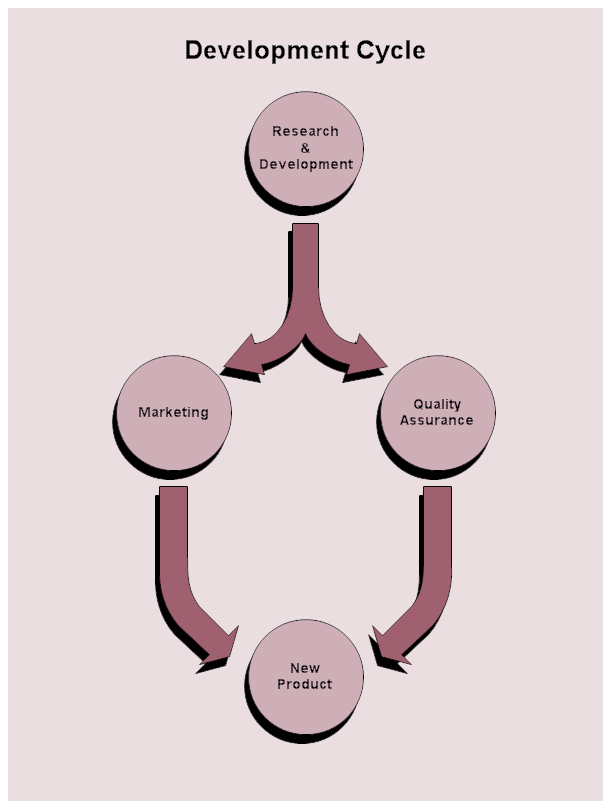
This chart shows the development cycle starting with research and development
and ending in a new product.
If you haven't already done so, first
download the
free trial version of RFFlow. It will allow you to open any chart and make
modifications.
Once RFFlow is installed, you can open the above chart in RFFlow by clicking
on
development_cycle.flo.
From there you can zoom in, edit, and print this sample chart. It is often
easier to modify an existing chart than to draw it from scratch.
To draw this chart without downloading it, run RFFlow and click on the
More
Shapes 
button, click the
Block Diagrams & Arrows stencil, and
then click the
Add Stencil button.