RFFlow 5 Professional Flowcharting

Professional Flowcharting Software

Home | Samples | Overview | Free Trial | Tutorial | Purchase | Upgrade | Support | Search

Fishbone Diagram Template

Fishbone Diagram Template

Description
Fishbone diagrams, Ishikawa diagrams, and cause-and-effect diagrams are all the 
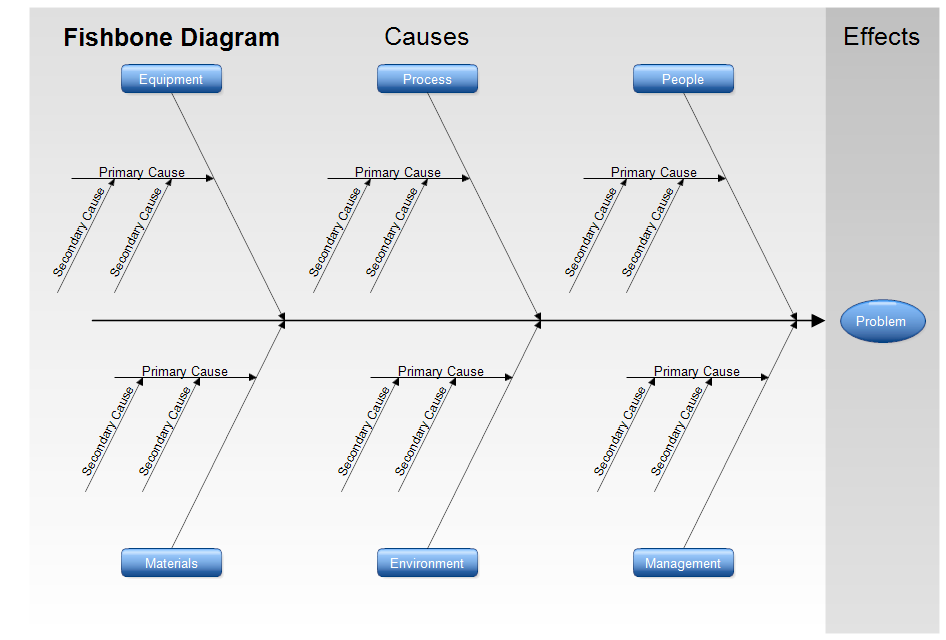
same thing. The effect or problem is placed on the right. A large arrow, the spine, points to the effect. Diagonal arrows with rectangles at the end show the categories of causes. Some standard categories are shown in the above diagram. They are Management, Environment, etc. Primary causes are listed on arrows that connect to the categories. Secondary causes further explain the primary causes.

For example, the category may be "Delays in Payment at a store" with one of the primary causes being "Time needed to write checks" and a secondary cause being "Approval needed for large checks."

The above template is ready for you to download and modify for your fishbone diagram.
Drawing Instructions
If you haven't already done so, first download the free trial version of RFFlow. It will allow you to open any chart and make modifications.

Once RFFlow is installed, you can open the above Ishikawa diagram in RFFlow by clicking on fishbone-template.flo. From there you can double-click to edit the text, move shapes around, and fully customize your cause-and-effect diagram. It is easier to modify an existing chart than to draw it from scratch.

To draw this diagram without downloading it, run RFFlow and click on the More Shapes button The More Shapes Button. Then scroll and click on the Cause-Effect (Fishbone) stencil and finally click the Add Stencil button.

Register
| Documentation | Privacy and Security | Version Information | Free Additional Shapes | Software Resellers | Free Viewer | Contact | Full Version
RFF Electronics
PO Box 1244 a gray dot Loveland CO 80539-1244 USA a gray dot Phone 970 663 5767 a gray dot www.rff.com a gray dot rff@rff.com
Copyright © 1996-2024 RFF Electronics. All rights reserved.