RFFlow 5 Professional Flowcharting

Professional Flowcharting Software

Home | Samples | Overview | Free Trial | Tutorial | Purchase | Upgrade | Support | Search

Fishbone or Cause and Effect Diagram

Cause-And-Effect Diagram or Fishbone Diagram

Description
Cause-and-effect diagrams are also called Ishikawa diagrams after their creator, Dr. Kaoru Ishikawa. These diagrams are used in identifying and organizing the 
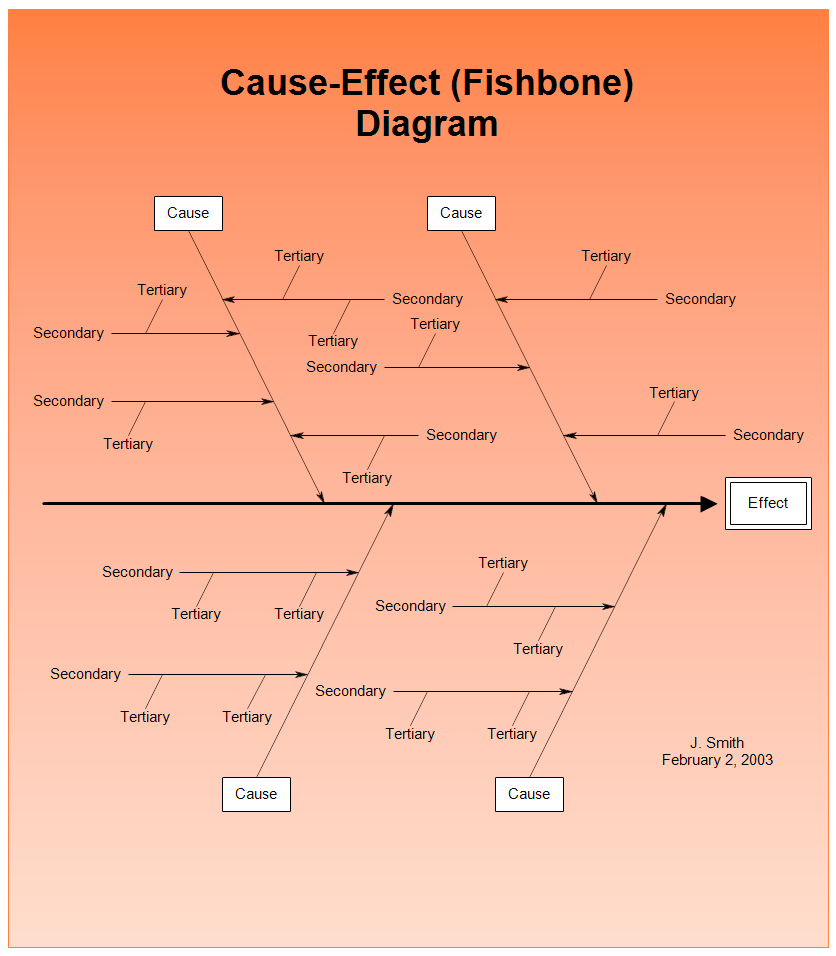
possible causes of a problem. They are sometimes referred to as fishbone diagrams because they resemble the skeleton of a fish, with a head, spine, and bones.

The problem you are investigating is placed in a box on the right side of the fishbone diagram. It is labeled Effect in the diagram above.

The spine is the large arrow going horizontally from left to right and pointing to the Effect box on the right.

The lines diagonally pointing to the spine are the main categories of potential causes of the problem. The smaller lines are more detailed causes of the problem.
Drawing Instructions
If you haven't already done so, first download the free trial version of RFFlow. It will allow you to open any chart and make modifications.

Once RFFlow is installed, you can open the above chart in RFFlow by clicking on Fishbone.flo. From there you can zoom in, edit, and print this sample chart. It is often easier to modify an existing chart than to draw it from scratch.

To draw this chart without downloading it, run RFFlow and click on the More Shapes The More Shapes Button button. Scroll to the Cause-Effect (Fishbone) stencil, click it, and then click the Add Stencil button.

Register
| Documentation | Privacy and Security | Version Information | Free Additional Shapes | Software Resellers | Free Viewer | Contact | Full Version
RFF Electronics
PO Box 1244 a gray dot Loveland CO 80539-1244 USA a gray dot Phone 970 663 5767 a gray dot www.rff.com a gray dot rff@rff.com
Copyright © 1996-2024 RFF Electronics. All rights reserved.