![]() |
![]() |
|
![]() |
||
Professional Flowcharting | ![]() |
Home | Samples | Overview | Download Trial | Tutorial | Purchase | Upgrade | Support | Search |
![]() Gantt Chart - Project Schedule |
Description | Gantt charts like the one shown above can be automatically drawn in RFFlow
from data you input. See How to Draw a Gantt
Chart to see how this is done. You can also draw Gantt charts using the
stencils and shapes provided in RFFlow. 
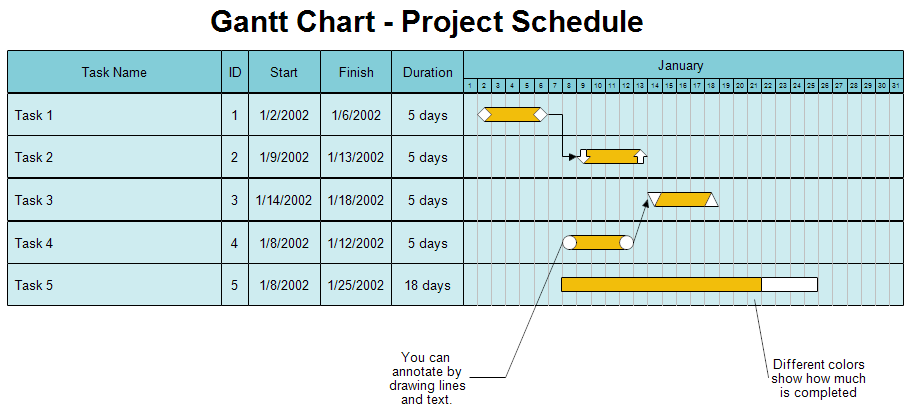
This chart includes columns for the start date of the task, finish date, ID, and duration of each task. This chart shows the days required to complete a task. You can also draw Gantt charts using hours, weeks, or months. |
Drawing Instructions | First download the
free trial version of RFFlow. It will allow you to open any chart and make
modifications. Once RFFlow is installed, you can open the above chart in RFFlow by clicking on gantt1.flo. From there you can zoom in, edit, and print this sample Gantt chart. It is often easier to modify an existing chart than to draw it from scratch. To draw this chart without downloading it, run RFFlow and click on the More Shapes ![]() To draw this chart by simply inputting the data and letting RFFlow draw the chart, see How to Draw a Gantt Chart. |
Register | Documentation | Privacy and Security | Version Information | Free Additional Shapes | Software Resellers | Free Viewer | Contact | Full Version |
RFF Electronics |
PO Box 1244 ![]() ![]() ![]() ![]() |
Copyright © 1996-2018 RFF Electronics. All rights reserved. |