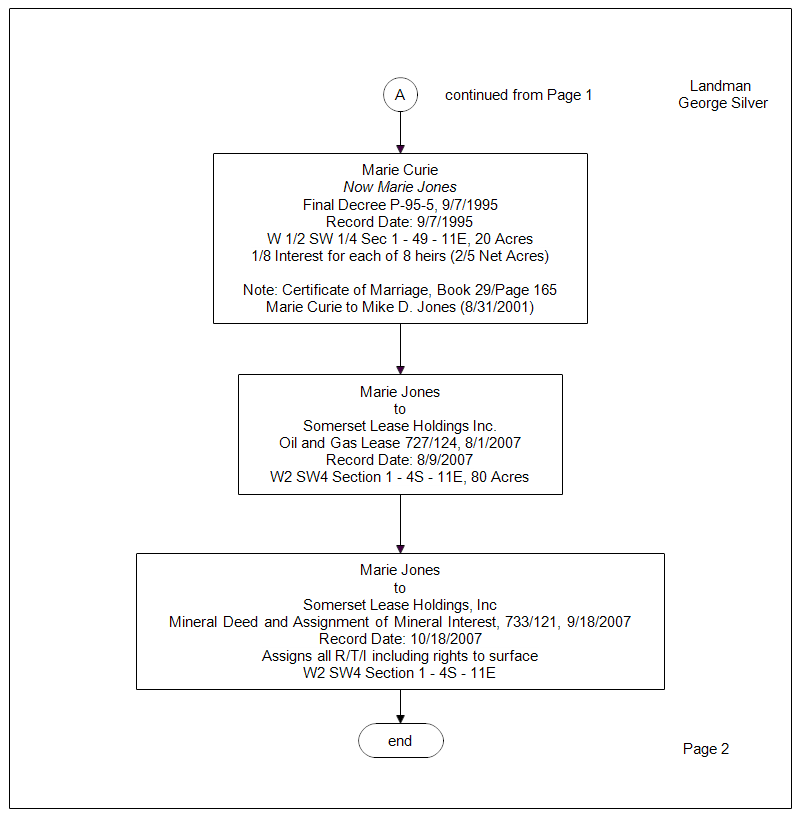
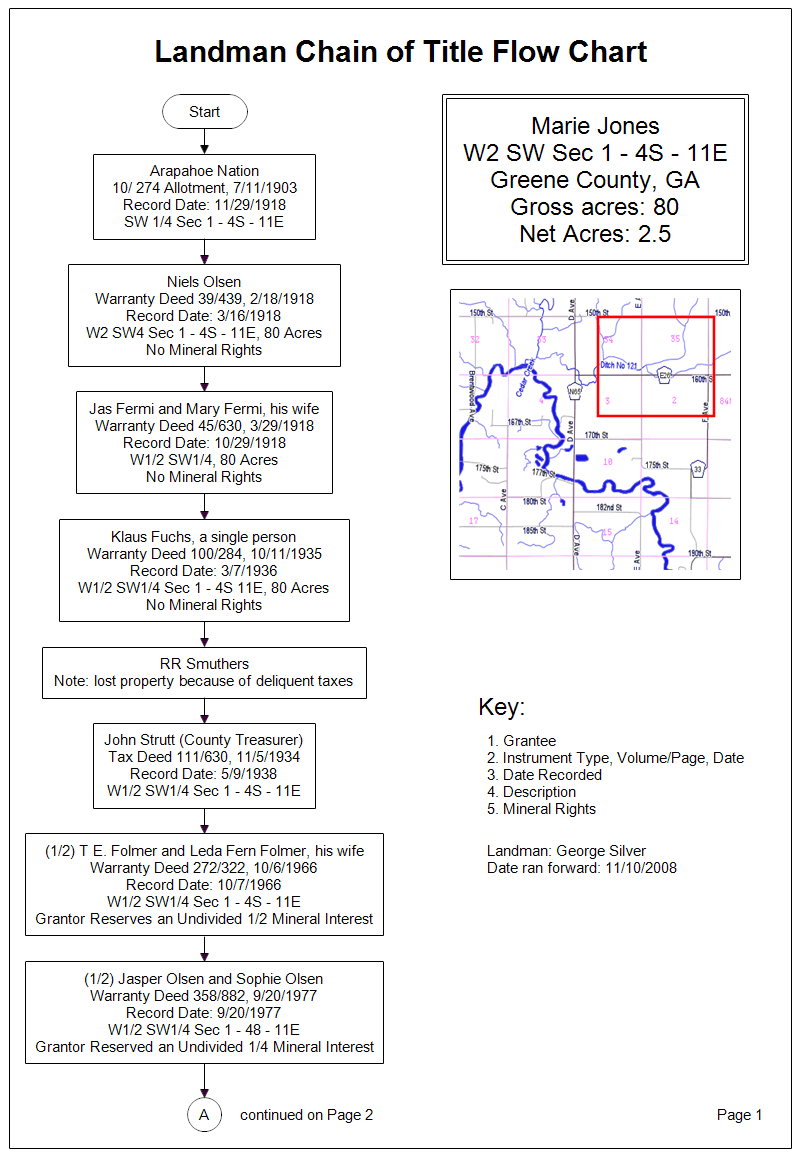
The flow chart above shows who owned the property and the mineral rights for the property at
" W2 SW Sec1 - 4S - 11E " starting in 1903 and going to the present. (All the addresses
and names in this chart are fictitious.) Such flow charts start with the earliest
documented records. Drawing chain of title with RFFlow is easy. The difficult part for landmen is
finding the information in the County Records to prepare the chart. The data is often
entered into in a spreadsheet or runsheet first and then moved to a flowchart. The data is in
chronological order. This chart has a box for each transfer of title and each box includes:
- The Grantee, who is acquiring the land
- The instrument, usually a deed, offically showing the transfer with enough information to locate the document, and the date of the document
- The date of record when the transfer becomes official
- A description of the property. It is good to include a picture of the plot if available.
- A statement about the mineral rights
You may want to include more information in each box. If you are doing the chart
for a Title Attorney, they will specify the data needed. These charts can get really long.
If you have to print on standard size paper, you will need a
multi-paged chart. The second and final page for this chart is shown below.
If you haven't already done so, first
download the
free trial version of RFFlow. It will allow you to open any chart and make
modifications.
Once RFFlow is installed, you can open the above charts in RFFlow by clicking
on
landman-chart-1.flo
or
landman-chart-2.flo.
From there you can zoom in, edit, and print this sample chart. It is often
easier to modify an existing chart than to draw it from scratch.
To draw this chart without downloading it, run RFFlow and use the Sample
Stencil.
Some helpful hints:
- We use the terminal shape to show where the chart starts and ends.
This is optional but we think it is a good idea.
- Landman charts basically use the standard rectangle, which is the 23rd
shape from the top in the Sample Stencil. Click the shape and enter the text.
The shape expands around your text.
- To show that the chart continues on another page, draw a circle with a letter
and reference that same letter on a folowing page.
- To insert a picture, click Insert in the main menu of RFFlow and then click
"Picture from File."
- The last three boxes show the Grantor and the Grantee, which is actually more
clear and could be done throughout the entire chart.
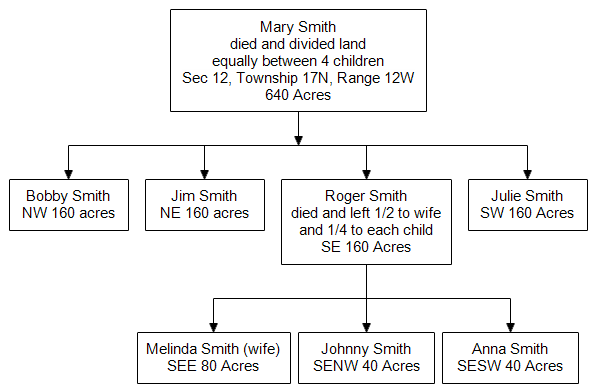
- Land is often divided up among the offspring. A sample of this is shown below.
Determing the mineral rights over several generations can get complicated.

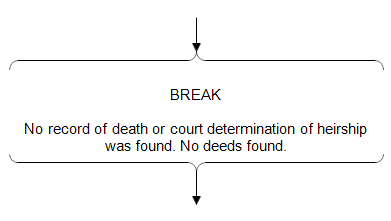
- Sometimes the landman will be unable to find the next deed or even a record of death,
so the chain of title is incomplete.
In such cases, just use a bracket shape, type BREAK, and explain the circumstances as shown below.
Then search for relatives and continue with the next recorded deed.
- Remember that these charts are only as good as the data. Acquiring
the data is the hard part and that is what landmen get paid for.


