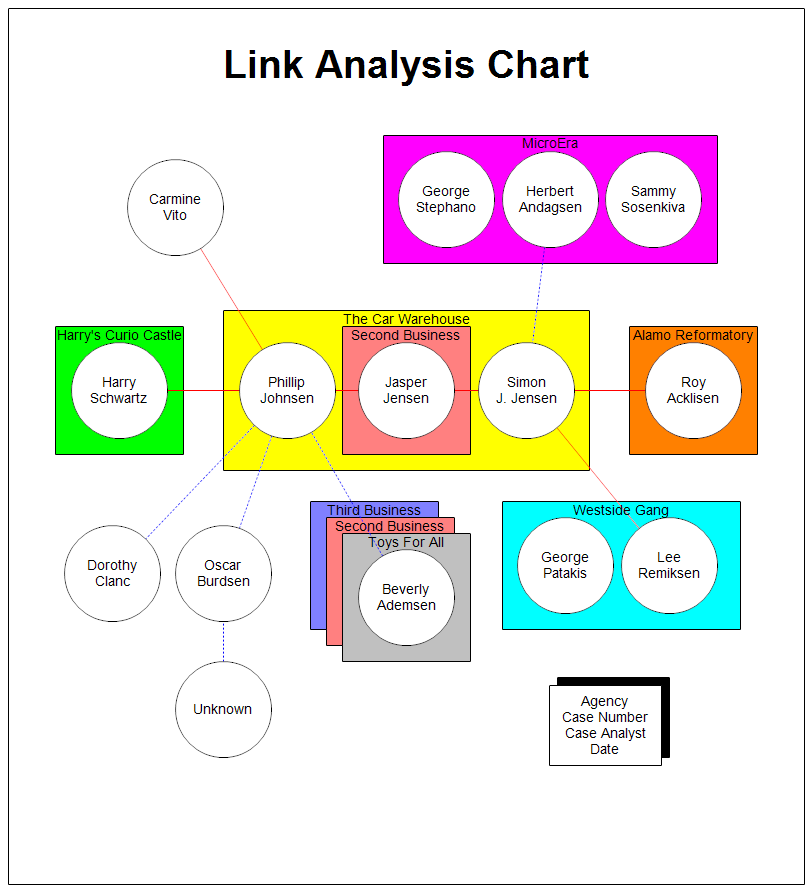
The diagram above is a link analysis chart that was automatically drawn
using the RFFlow software. It shows a graphic representation of investigative
data. People are shown as circles with the name in the center. You can also
insert photographs into your RFFlow chart if they are available. Businesses
are represented as rectangles with the key individuals inside the rectangle.
Solid lines show confirmed associations while dotted lines show suspected
associations.
To enter the data and have RFFlow generate a link analysis chart, see the
tutorial:
How to Draw a Link Analysis
Diagram.
If you haven't already done so, first
download the
free trial version of RFFlow. It will allow you to open any chart and make
modifications.
Once RFFlow is installed, you can open the above chart in RFFlow by clicking
on
link_analysis_sample.flo.
From there you can zoom in, edit, and print this sample chart. It is often
easier to modify an existing chart than to draw it from scratch.
To draw this chart without downloading or generating it from the data, run RFFlow and click on the
More
Shapes 
button. Scroll to the
Criminal Analysis folder and click the plus
sign to open it. Then click the
Link Analysis stencil and click the
Add
Stencil button.
For training in criminal analysis, see
mctft.org.


