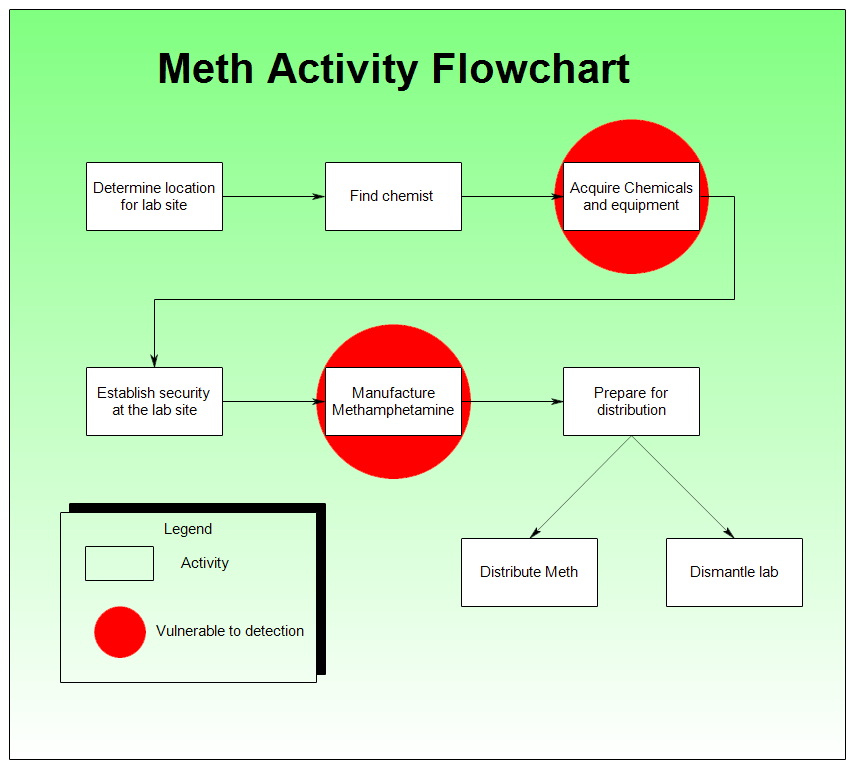
An activity flowchart shows how a criminal endeavor operates. It doesn't
include date and time information like a timeline, but does explain the steps
the criminals go through to set up shop. By understanding the steps involved in a criminal
pursuit, the investigator can decide which areas are vulnerable to detection.
Steps vulnerable to detection are then marked with red circles.
If you haven't already done so, first
download the
free trial version of RFFlow. It will allow you to open any chart and make
modifications.
Once RFFlow is installed, you can open the above chart in RFFlow by clicking
on
meth_activity_sample.flo.
From there you can zoom in, edit, and print this sample chart. It is often
easier to modify an existing chart than to draw it from scratch.
To draw this chart without downloading it, run RFFlow and click on the
More
Shapes 
button. Scroll to the
Criminal Analysis folder and click the plus
sign to open it. Then click the
Activity Flowchart stencil and click the
Add
Stencil button.
For free training in criminal analysis, see:
mctft.org.


