This page covers the differences between RFFlow 5 and earlier versions of
RFFlow. For a description of the features and capabilities of RFFlow
5, see the
Overview
and
Tutorial.
A New User Interface
The user interface in RFFlow 5 has been completely redesigned. Each step in
drawing a chart has been optimized. The Windows interface standards have been
followed. Although users of RFFlow 1, 2, 3, and 4 may experience some
unfamiliarity with using RFFlow 5 at first, they should quickly adapt to the
new user interface and find that it increases their productivity.
Previous versions of RFFlow were highly modal. A user would click on a
command button and then could do one operation. For example, in RFFlow 4, you
clicked on the
Select button and then any object you clicked on would
be selected. You could also draw a selection rectangle around objects at
this time. While in the selection mode, the only thing you could do was
select objects. This selection mode continued until you clicked on
another command button.
In RFFlow 5, there is no
Select button. You can just draw a
selection rectangle around the shapes you want selected. You can also click on one object
to select it or press down the SHIFT key or the CTRL key and click on several
objects to select them. Selection in RFFlow 5 is now like selecting files in Windows.
- Click on one object to select it.
- Drag the mouse drawing a rectangle around several objects to select
them.
- Press down the CTRL key on the keyboard and click on individual objects
to select them. Clicking once selects the object, clicking again removes
the selection from that object.
- Press down the CTRL key and draw a rectangle to add to the current
selection.
- Click outside any object to unselect all objects.
Another example to show the difference between the modality of previous
RFFlow versions and the new user interface of RFFlow 5 is in sizing a shape.
In RFFlow 4, you clicked on the
Size button and then clicked on a
shape. The shape would then show handles that you dragged to size the
shape. After sizing the shape you clicked the
OK button and then you
could click on another shape to size it. But all you could do is size shapes
until you clicked on another command button.
In RFFlow 5, there is no
Size button. You just click on a shape and
handles are displayed. Drag the handles to size the shape and then click
outside the shape when you are done.
The new user interface in RFFlow 5 eliminates most of the modes that were
in previous versions. Two useful modes are still present. When you click on a line in a stencil,
you enter a line drawing mode. You can now drag the mouse to draw lines and
you can draw as many as you like, but you can only draw lines. It's convenient
to use the line drawing mode if you place all the shapes in your chart first
and then connect them with lines all at once. You exit this mode by clicking a
button or drawing another shape. You can avoid the line drawing mode by
dragging a line from a stencil into your chart. If you like to draw a shape
and then a line, and so forth, you should drag each line into your chart.
The other mode in RFFlow 5 is auto connection. You click the

button.
Then you can click on two shapes to connect them. This allows you to quickly
connect all the shapes in a flowchart.
The user interface of RFFlow 5 has been improved by making it less modal
than earlier versions of RFFlow. This lets you draw a chart in less time.
Consistent Operations
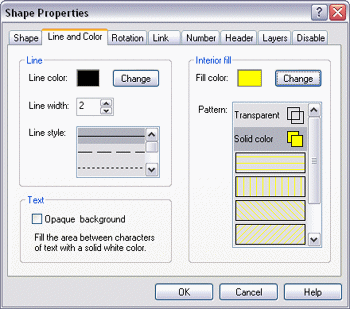
In RFFlow 5, when you right-click on an object and choose
Properties,
the Shape Properties dialog box shown below appears. This lets you change the
properties of the shape. When you select a group of objects, right-click
on any of the selected objects, and choose
Properties, you will also get
the Shape Properties dialog box. Changing the properties of several
objects is identical to changing the properties of one object. This
consistency makes the program easier to learn. If you know how to fill one shape with color, you can also
fill a group of selected shapes with color.
Float Over Highlight
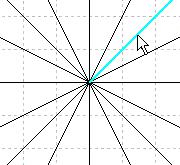
When the mouse cursor moves over a shape or line in RFFlow 5, that object
will change color so you know which shape will be selected when you click.
This helps you pick out objects that are close together.
Right-click Menus
In RFFlow 5, right-clicking on a shape or group of selected shapes brings up
a menu that lets you quickly duplicate, delete, change properties, edit text,
and add shapes to a stencil.
Moving Shapes
To move an object in RFFlow 5, just drag it. If you want to move
several objects, select them and drag any of the selected objects.
Drawing Shapes
In RFFlow 5, click on a shape, type in the text, and click
OK.
The shape will show up in the center of the screen and be selected. Drag it to
position it. Another way to draw a shape is to just drag a shape from a
stencil into your chart.
Drawing Curves
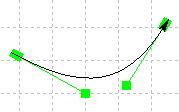
Click on a curve or drag it from a stencil into your chart. Drag the center
of the curve to move it and drag the handles to change its curvature. There is
no more clicking on 4 points as in RFFlow 3 and 4.
Duplicate
In RFFlow 4, you clicked the
Duplicate button to be in that mode and then
dragged objects to duplicate them. In RFFlow 5, you do the same thing without
entering a mode. Just drag an object or group of selected objects with the
CTRL key down and you will be dragging duplicates. You can also right-click on
an object or group of selected objects in RFFlow 5 and choose
Duplicate.
Alternatively, you can select a group of objects and click the
Duplicate
button.
Delete
To delete objects in RFFlow 5, right-click on a shape or group of selected shapes and choose
Delete.
You can also select the shapes and click the
Delete button or the
Delete key on the keyboard.
No Toolbars Needed
In RFFlow 5, you can do all the drawing and editing of charts without any
toolbars displayed.
This frees up more space on the screen for your chart. Just follow these hints:
- To scroll, drag the mouse with the right button pressed.
- To duplicate, drag the object with the CTRL key pressed.
- To zoom in, hold the right mouse button down and click the left button.
- To zoom out, hold the left mouse button down and click the right button.
- Right-click objects or selected objects to change their properties
Since the modal commands have been removed in RFFlow 5, the toolbars are no longer needed.
Disable Selection for Background Shapes
You may want to make a large background rectangle filled with color or a
gradient and then draw a chart on top of that background. The large background
rectangle should be placed on a stacking order of 8 so it is behind all other
objects. This is done by right-clicking on the rectangle, choosing
Properties,
and going to the
Layers tab.
Center the background rectangle on your paper by clicking the

button.
Then right-click on the rectangle, choose
Properties, and go to
the
Disable tab. Check
Disable selecting and moving of this object
and click
OK.
This allows you to draw selection rectangles inside the
background rectangle without moving the background rectangle itself. It
basically makes the background rectangle fixed in position. If you need to
change it later, right-click and choose
Properties.
Documentation on the Web
The Web site for RFFlow 5 has a Web page devoted to the
printed
documentation. The documentation includes:
- RFFlow Quick Reference
- RFFlow User's Guide
- RFFlow Shapes
- RFFlow Brochure
Upgrade to RFFlow 5
Users of RFFlow 1, 2, 3, or 4 can
upgrade to RFFlow
Version 5 at low upgrade prices. Once you purchase the upgrade to RFFlow
5, all upgrades within RFFlow 5 (5.0X) will be free for you to download when
they become available.


