You can make your flowcharts easier to understand and less
subject to errors by using only a fixed set of structures. These structures
include:
- Sequence
- Decision
- Loop
- Case
Whether you are flowcharting software programs or business processes, using
only these structures will make it easier to find and correct errors in your
charts. Each structure has a simple flow of control with one input and one
output. These structures can then be nested within each other. Any chart can be drawn using
only these structures. You do not have to use GOTO or draw spaghetti diagrams
just because you are drawing a flowchart. You can draw structured
flowcharts.
The samples shown below were all drawn using RFFlow. If you
don't have RFFlow installed, you can
download
the free trial version. It will allow you to draw charts just like these.
Once RFFlow is installed, run RFFlow and click on the
More Shapes

button.
Scroll to the
Flowcharting folder and click the plus sign to open it.
Click the
Colored Edge Shapes stencil and then click the
Add Stencil
button.
To download this chart, click
flowchart_structure_sequence.flo.
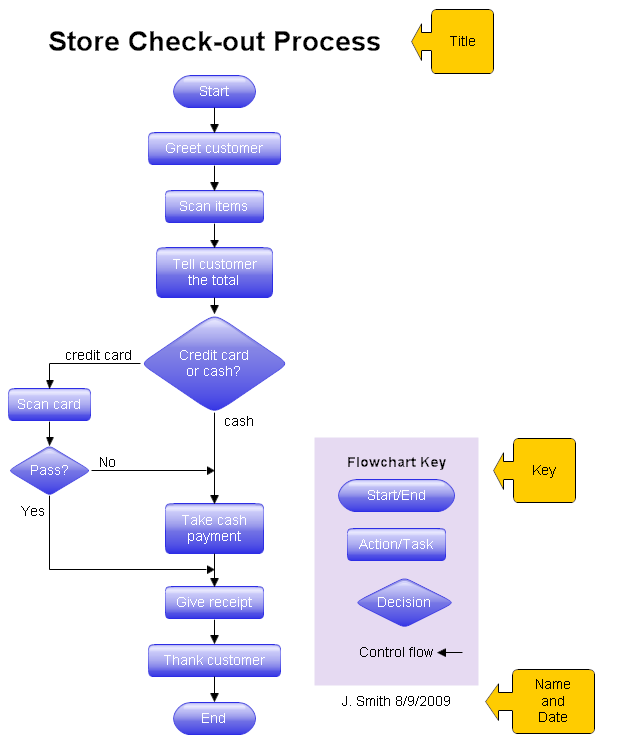
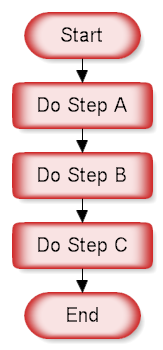
The flowchart above demonstrates a sequence of steps. The reader would
start at the Start shape and follow the arrows from one rectangle to the
other, finishing at the End shape. A sequence is the simplest
flowcharting construction. You do each step in order.
If your charts are all sequences, then you probably don't need to draw a
flowchart. You can type a simple list using your word processor. The power of
a flowchart becomes evident when you include decisions and loops.
RFFlow allows you to number your shapes if you wish. Run RFFlow and click on
Tools,
Number Shapes, and put a check mark in
Enable numbers for the entire
chart. You can also choose to have a number or not in each individual
shape and you can quickly renumber your chart at any time.
To download this chart, click
flowchart_structure_decision.flo.
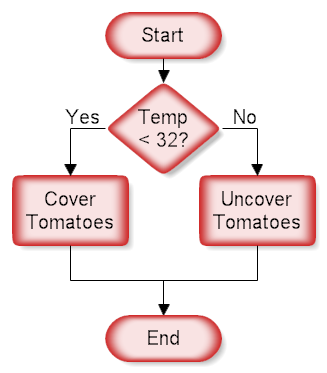
This structure is called a decision, "If Then.. Else" or a conditional. A
question is asked in the decision shape. Depending on the answer the control
follows either of two paths. In the chart above, if the temperature is going
to be less than freezing (32 degrees Fahrenheit) the tomatoes should be
covered. Most RFFlow stencils include the words "Yes" and
"No" so you can just drag them onto your chart. "True" and
"False" are also included in most of the flowcharting stencils.
To download this chart, click
flowchart_structure_loop.flo.
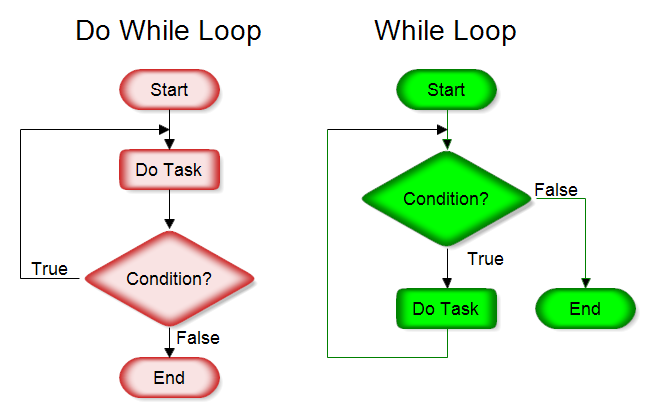
This structure allows you to repeat a task over and over. The red chart
above on the left does the task and repeats doing the task until the condition
is false. It always does the task at least once. The green chart on the right checks the condition first and
continues doing the task while the condition is true. In the green chart the task may not be done at all.
You can also have the conditions reversed and your loop is still a structured design loop.
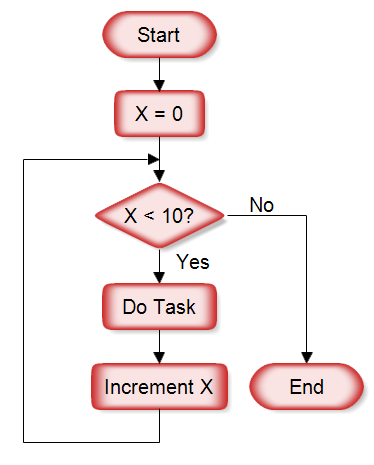
To download this chart, click
flowchart_structure_for_loop.flo.
The above chart is a "For Loop." In this example the task is performed
10 times as X counts from 0 to 10.
Depending on the condition, the task may not be performed at all.
There is also a "For Each" structure that
is like the for loop, but has no counter. It will go through each item of
a collection and do the task. You don't
have to know the length of the collection or use a counter.
It is essentially saying "do this for every item in the collection".
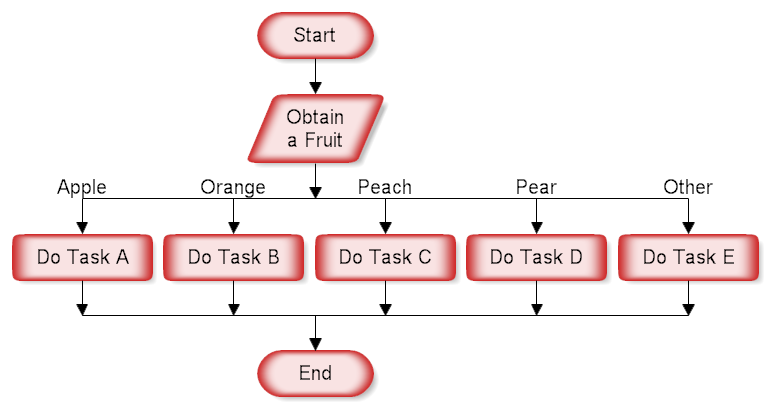
To download this chart, click
flowchart_structure_case.flo.
The structure above is called the case structure or selection structure.
The decision works fine if you have only two outputs, but if there are
several, then using multiple decisions makes the chart too busy. Since the
case structure can be constructed using the decision structure, it is superfluous,
but useful. The case structure helps make a flowchart more readable and saves
space on the paper.

 Connector
Block
Connector
Block Off Page Connector