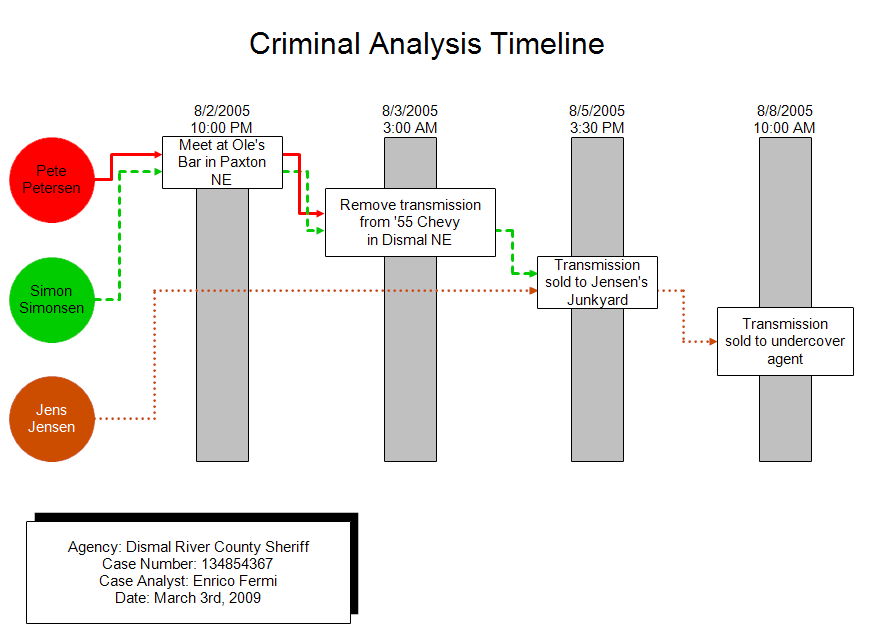
This timeline shows the events that took place during a criminal activity
and the people who were involved. It was automatically drawn in RFFlow from
the data. There are three styles of timelines that can be automatically drawn
in RFFlow. The above timeline is the Criminal Analysis Timeline style.
That style has the people or entities involved on the left in circles. The
events are in white rectangles on top of gray bars that have a date and time
at the top. Lines and arrows go from the people in circles to each event that
they took part in. The other two timeline styles are the Rectangle and Line
Timeline and the Bar Chart Timeline. We chose to not number the
events. RFFlow provides a large number of options you can use to customize
your timeline. Once the timeline is drawn, you can then edit it like any other
RFFlow diagram. This allows you to move shapes, edit text, change
colors, etc.
First
download the free trial
version of RFFlow. It will allow you to open any timeline or chart and make
modifications.
Once RFFlow is installed, you can open the above timeline in RFFlow by
clicking on
timeline_criminal_analysis.flo.
From there you can zoom in, edit, and print this sample timeline. It is often
easier to modify an existing timeline than to draw it from scratch.
To generate this timeline from the data, download the text file
timeline_criminal_analysis.txt
Then run RFFlow and click
Tools,
Auto Charts, and
Draw
Timeline. Follow the instructions to open the text file and generate the
timeline.
To edit the data, run RFFlow and click
Tools,
Auto Charts, and
Enter
Timeline Data. Then open the text file.
To draw timelines from scratch without downloading or generating the timeline
from data, run RFFlow and click on the
More Shapes

button. Scroll to the
Criminal Analysis folder and click the plus
sign to open it. Click the
Event Flow and Timeline stencil and click
the
Add Stencil button.
To learn how to automatically generate a timeline in RFFlow, see:
How to Draw a Timeline


