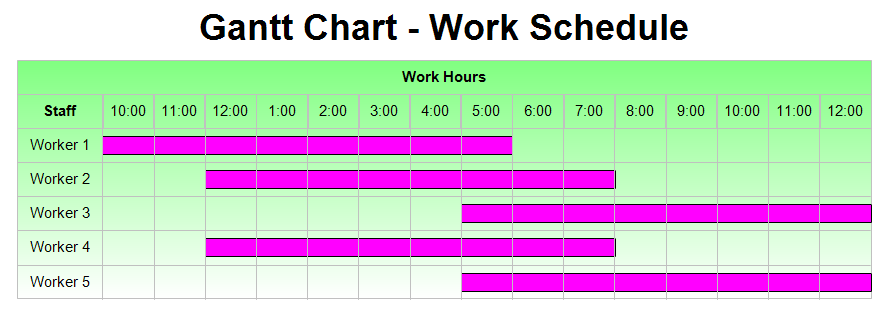
This chart shows what hours each employee works. It allows one to quickly
determine how many workers are present during the day. For example, from 5:00
to 6:00 all 5 workers are present. You can also draw charts in RFFlow using
days, weeks, or months.
First
download the
free trial version of RFFlow. It will allow you to open any chart and make
modifications.
Once RFFlow is installed, you can open the above chart in RFFlow by clicking
on
workschedule.flo.
From there you can zoom in, edit, and print this sample chart. It is often
easier to modify an existing chart than to draw it from scratch.
To draw this chart without downloading it, run RFFlow and click on the
More
Shapes 
button, scroll to the
Gantt Chart stencil, click on it and then click
the
Add Stencil button.
To learn how to input the data and have RFFlow automatically draw the Gantt
chart, see:
How to Draw a Gantt Chart