For a general introduction to cause-and-effect mapping, see
root-cause-analysis.php.
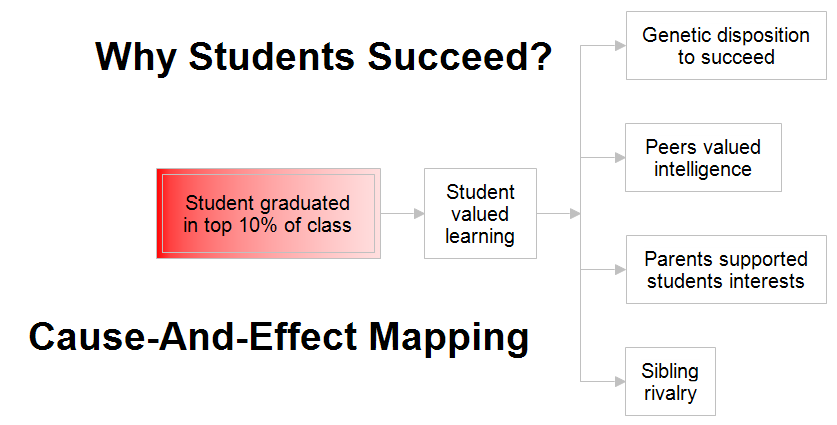
Most causal maps deal with some problem. This cause-and-effect map is different in that the
primary effect on the left is to be desired rather than avoided. In the above
causal map, the student graduated in the top 10% of his class and we are asking
why this happened. The primary effect is shown on the left in red. Color is not necessary in
causal mapping, but it is helpful to highlight the main effect.
You read this chart from left to right and add the words "was caused
by" at each line. For example, "Student valued learning" was caused
by "Genetic disposition to succeed" and/or "Peers valued
intelligence" and/or "Parents supported students interests"
and/or "Sibling rivalry."

Professional Flowcharting Software
|
|
|
|
|
|
|
|
 and add the Causal Mapping
Stencil.
and add the Causal Mapping
Stencil.
 Loveland CO 80539-1244 USA