Root cause analysis involves drawing a causal map. A causal map answers the
question "Why did something happen?"
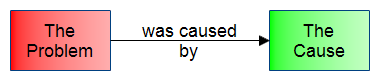
To start out, you decide what the problem is. The problem is described in a box on the left of
the diagram. An arrow is drawn to the right where another box lists the
cause of the problem.
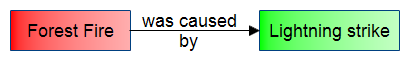
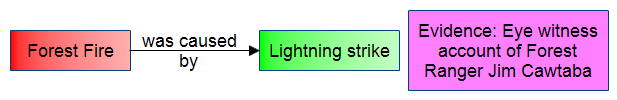
For example, a forest fire may have been caused by a lightning strike.
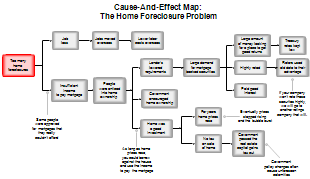
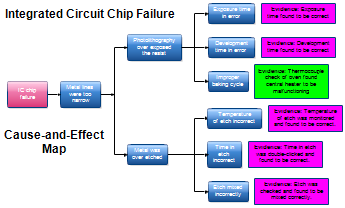
A causal map is easy to draw. The difficult part is deciding what the causes
are. Each cause may be the result of some other cause.
A problem or cause may have several possible causes.
So the diagrams can get large with multiple causes and causes having other
multiple causes. You can also start out with more than one problem if you
wish. There may be two or more problems listed on the left.
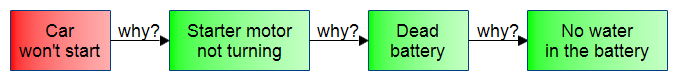
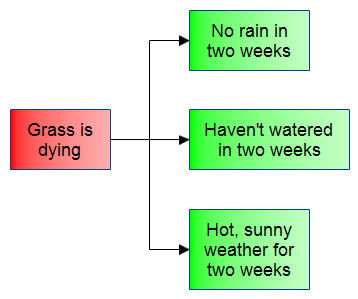
You read the causal map from the left to the right. When you get to a line with
an arrow, read the words "was caused by" or "why." In the
above diagram, the fact that the grass is dying "was caused by" no
rain and not watering and hot weather.
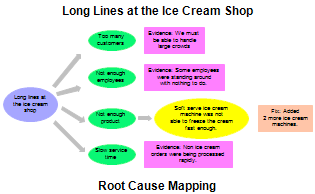
If you have evidence about a cause, you can place that in a box next to the
cause as shown below. Color can be used to make the primary effect or problem
look different from the causes and evidence, but color is not essential.
Just as a tree can have many roots, the problem you are examining can have many
causes. The word "root" in Root Cause Analysis does not mean you are
looking for the "sole" cause. There may be several things that have
to happen to create the problem.
Causal maps are similar to
fishbone or Ishikawa
diagrams, except causal maps
read from left to right and you don't have to draw diagonal lines with text on
them. Both are useful in showing the causes of problems.
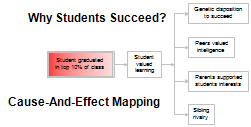
The starting effect on the left is usually something that is
not desired, but you can draw causal maps starting with a desired effect on the
left as shown with the Successful Student Causal Map below.
The following drawings can be downloaded and edited. It is often easier to modify an
existing drawing than to draw a new one. If you haven't done so already,
download
the free trial version of RFFlow. Once it is installed, you can open the
samples on this page directly in RFFlow by clicking the links to the
right of each picture. From there you can zoom in, edit, and print the
drawing.