
- Relationship Maps show the overall view. They show the departments of an organization and how they interact with suppliers and customers.
- Cross-functional Maps or Swim Lane Charts show which department performs each step and the inputs and outputs of each step. These maps have more detail than a relationship map but less than a flowchart.
- Process Flow charts or Process Flow Diagrams take a single step from a cross-functional map and expand it to show more detail. Process flow charts and process flow diagrams are the same thing.
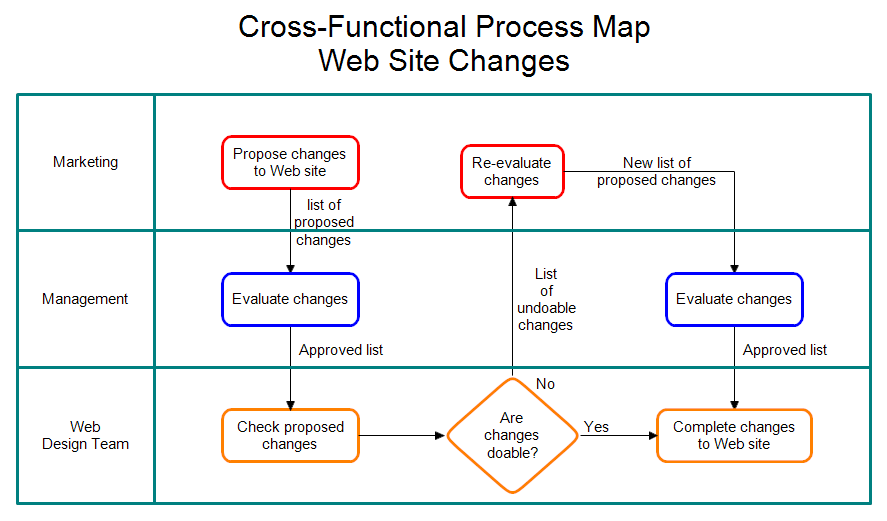
A cross-functional map has the departments or groups listed on the left. In the chart above, Marketing, Management, and Web Design Team are listed. The first step is "Propose changes to Web site." It is listed to the right of the Marketing group to show that the proposal came from Marketing. If a box is in the "swim lane" of your department, then you are responsible for it. The next box is "Evaluate changes" which is done by Management. The arrows between boxes show what is transferred. These are the inputs and outputs of the process steps. Management gets a document that proposes changes to the Web site.
You can have decision steps in your cross-functional map as shown above. A decision results in flow branching in two or more directions. In the chart above, the design team must decide whether the proposed changes to the web site are possible.
The steps involved in drawing a cross-functional map are:
- List the functions on the left. These are usually departments, but can be people, groups, sections, divisions or whatever.
- Draw the swim lanes so we know who is responsible for each step.
- Fill in the steps
- Fill in the inputs and outputs for each step