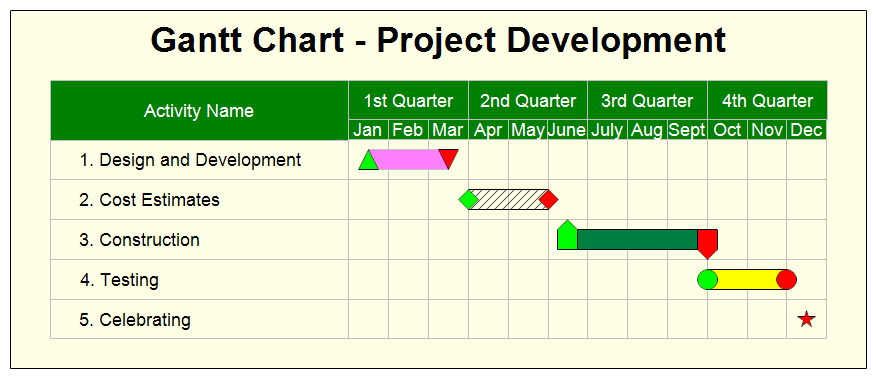
A Gantt chart or project schedule includes a list of tasks on the left and
horizontal bars on the right showing when the tasks begin and end. You
can draw charts with one hour, day, week, or month being the smallest
incremental value.
In the chart above the different tasks have bars of different colors. Green
represents the beginning of a task and red the completion.
First
download the
free trial version of RFFlow. It will allow you to open any chart and make
modifications.
Once RFFlow is installed, you can open the above chart in RFFlow by clicking
on
project_development.flo.
From there you can zoom in, edit, and print this sample Gantt chart. It is often
easier to modify an existing chart than to draw it from scratch.
To draw this chart without downloading it, run RFFlow and click on the
More
Shapes
button, scroll and click the
Gantt Charts stencil and click the
Add
Stencil button.
To simply input the data and let RFFlow draw the Gantt chart, see:
How to Draw a
Gantt Chart