These charts can be downloaded and edited. It is often easier to modify an
existing chart than to draw a new one.
of RFFlow. Once it is installed, you can open the samples on
this page directly in RFFlow by clicking the links to the right of each
picture. From there you can zoom in, edit, and print the sample chart.
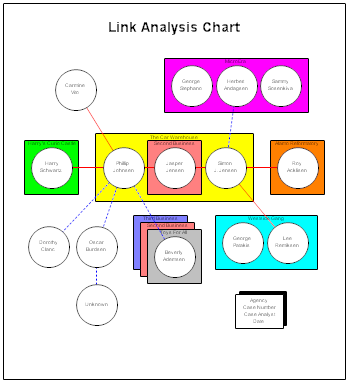
RFFlow can automatically generate a link analysis chart from your data.
For more information, see the tutorial
How to Draw a Link Analysis Diagram.
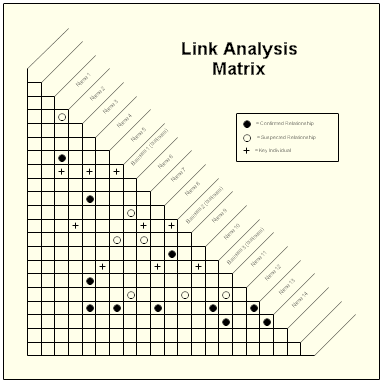
After you fill out the matrix, RFFlow can automatically draw a link analysis diagram.
See the tutorial:
How to Draw a Link Analysis Diagram.
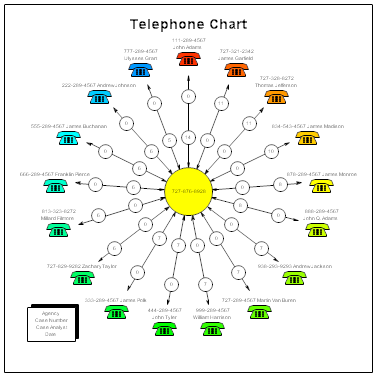
RFFlow can automatically generate a telephone frequency analysis chart from your data. See the tutorial:
How to Draw a Telephone Frequency Analysis Chart.
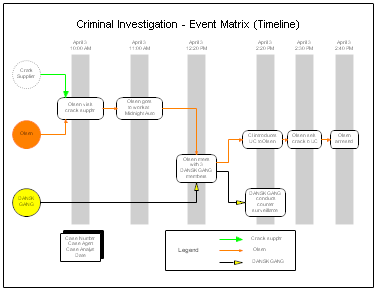
This timeline shows the events that happened in a criminal activity and
when they happened. See the tutorial:
How to
Draw a Timeline (Event Matrix).
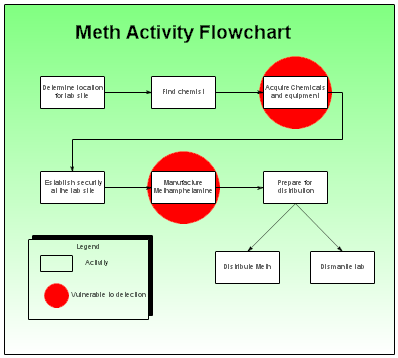
An activity flowchart shows an organization's method of operating.
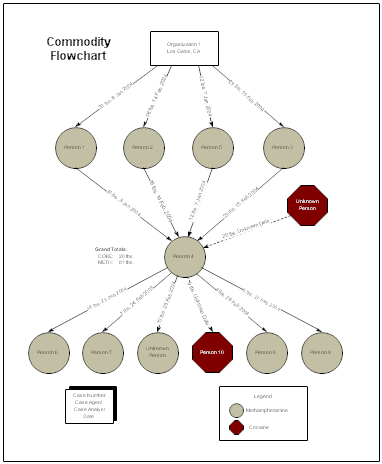
A commodity flowchart graphically shows the distribution pattern of
drugs, money, goods, or services.
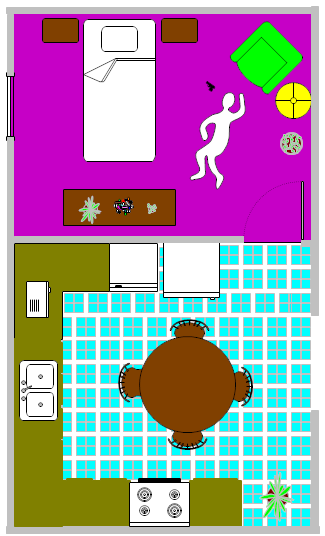
With RFFlow you can use the office and home layout shapes to draw two
dimensional crime scenes. These shapes are in the Floor Plans category of
stencils and in the Criminal Analysis category.
